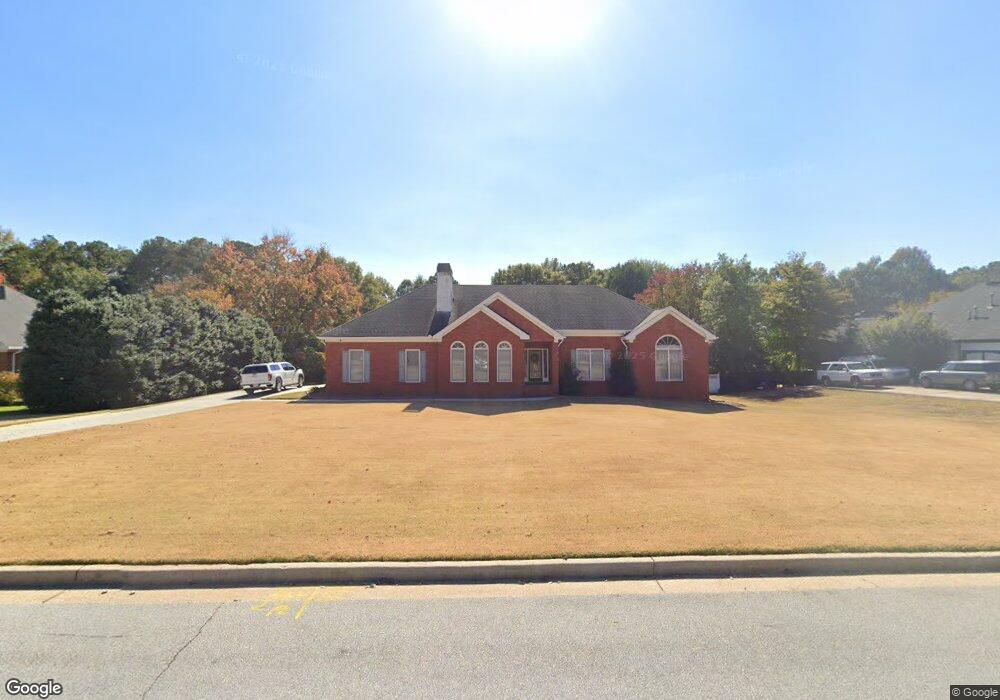
1210 Dover Place SE Conyers, GA 30013
Estimated Value: $389,131 - $481,000
3
Beds
3
Baths
2,403
Sq Ft
$181/Sq Ft
Est. Value
About This Home
This home is located at 1210 Dover Place SE, Conyers, GA 30013 and is currently estimated at $435,533, approximately $181 per square foot. 1210 Dover Place SE is a home located in Rockdale County with nearby schools including Barksdale Elementary School, Memorial Middle School, and Salem High School.
Ownership History
Date
Name
Owned For
Owner Type
Purchase Details
Closed on
Oct 17, 2006
Sold by
Us Bank Na 2005-5
Bought by
Moore James R and Moore Juanquitta C
Current Estimated Value
Home Financials for this Owner
Home Financials are based on the most recent Mortgage that was taken out on this home.
Original Mortgage
$237,500
Outstanding Balance
$140,069
Interest Rate
6.25%
Mortgage Type
New Conventional
Estimated Equity
$295,464
Purchase Details
Closed on
Jun 6, 2006
Sold by
Delgado Rebecca L
Bought by
Structured Asset Inv Loan Trus
Purchase Details
Closed on
Jan 24, 2003
Sold by
Goddard James F and Goddard Lisa B
Bought by
Ward Laura K
Home Financials for this Owner
Home Financials are based on the most recent Mortgage that was taken out on this home.
Original Mortgage
$201,600
Interest Rate
5.98%
Mortgage Type
New Conventional
Create a Home Valuation Report for This Property
The Home Valuation Report is an in-depth analysis detailing your home's value as well as a comparison with similar homes in the area
Home Values in the Area
Average Home Value in this Area
Purchase History
| Date | Buyer | Sale Price | Title Company |
|---|---|---|---|
| Moore James R | $250,000 | -- | |
| Structured Asset Inv Loan Trus | $227,554 | -- | |
| Ward Laura K | $252,100 | -- |
Source: Public Records
Mortgage History
| Date | Status | Borrower | Loan Amount |
|---|---|---|---|
| Open | Moore James R | $237,500 | |
| Previous Owner | Ward Laura K | $201,600 |
Source: Public Records
Tax History Compared to Growth
Tax History
| Year | Tax Paid | Tax Assessment Tax Assessment Total Assessment is a certain percentage of the fair market value that is determined by local assessors to be the total taxable value of land and additions on the property. | Land | Improvement |
|---|---|---|---|---|
| 2024 | $4,517 | $180,000 | $36,160 | $143,840 |
| 2023 | $4,012 | $166,160 | $31,480 | $134,680 |
| 2022 | $3,262 | $136,960 | $27,800 | $109,160 |
| 2021 | $3,158 | $124,600 | $22,160 | $102,440 |
| 2020 | $2,863 | $109,840 | $20,000 | $89,840 |
| 2019 | $2,440 | $93,760 | $9,800 | $83,960 |
| 2018 | $2,377 | $91,240 | $9,800 | $81,440 |
| 2017 | $2,073 | $80,520 | $9,800 | $70,720 |
| 2016 | $1,833 | $77,720 | $9,800 | $67,920 |
| 2015 | $1,679 | $72,280 | $9,800 | $62,480 |
| 2014 | $1,537 | $73,672 | $10,920 | $62,752 |
| 2013 | -- | $94,236 | $20,000 | $74,236 |
Source: Public Records
Map
Nearby Homes
- 1104 Brookfield Dr SE
- 1107 Brookfield Dr SE
- 926 Bell Rd SE
- 1296 Carman Ct SE
- 65 King James Ct SE
- 1120 Kinnett Rd
- 4824 Georgia 20
- 330 Christian Woods Dr SE
- 4217 SE Lindsey Way
- 4260 Brandy Ln SE
- 4773 Bell Cir SE
- 4822 Navajo Trail SE
- 4670 Cedar Brook Dr SE
- 4195 Stephanie Cir SE
- 4210 Stephanie Cir SE
- 604 Hamlet Ct SE
- 4710 Cedar Brook Dr SE
- 0 Dover Place SE Unit 8693665
- 0 Dover Place SE Unit 8659845
- 0 Dover Place SE Unit 8740820
- 0 Dover Place SE Unit 3165763
- 0 Dover Place SE Unit 3267215
- 0 Dover Place SE Unit 3272206
- 0 Dover Place SE Unit 7274254
- 1208 Dover Place SE
- 1212 Dover Place SE
- 1213 Dover Place SE
- 4579 N Woodlake Ln SE
- 1206 Dover Place SE
- 1211 Dover Place SE
- 4583 N Woodlake Ln SE
- 1214 Dover Place SE
- 1209 Dover Place SE
- 1215 Dover Place SE
- 1207 Dover Place SE
- 4587 N Woodlake Ln SE
- 1216 Dover Place SE