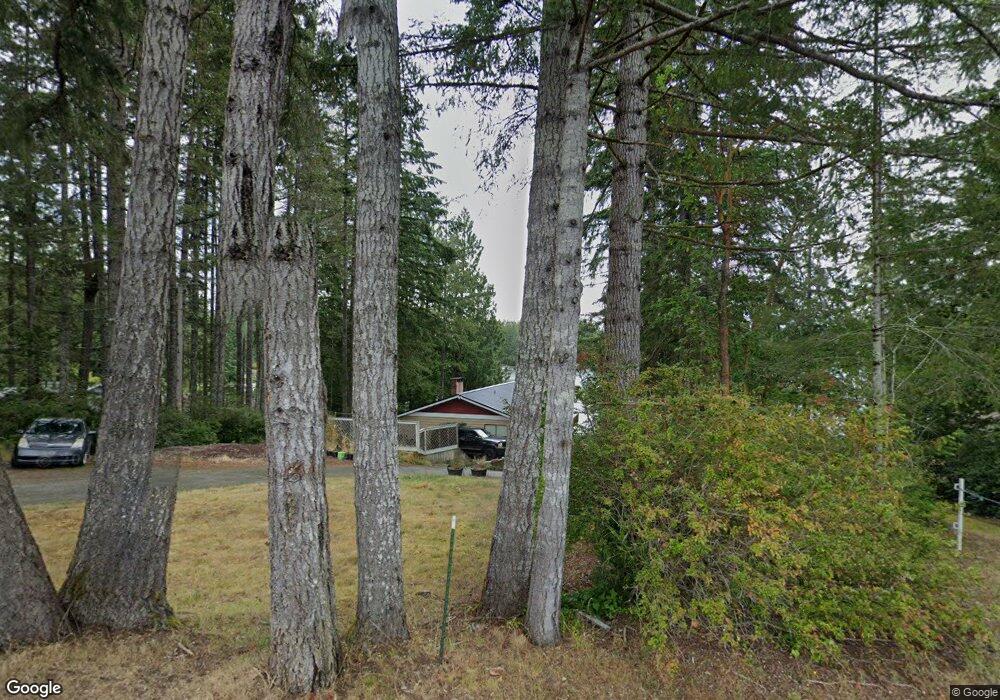
1210 E Benson Lake Dr Grapeview, WA 98546
Estimated Value: $789,214 - $987,000
About This Home
This home is located at 1210 E Benson Lake Dr, Grapeview, WA 98546 and is currently estimated at $907,054, approximately $255 per square foot. 1210 E Benson Lake Dr is a home located in Mason County with nearby schools including Grapeview Elementary/Middle School.
Ownership History
We collect this data history from publicly available records. To have your information removed, we recommend requesting removal directly through your county’s website.
Purchase Details
Home Financials for this Owner
Home Financials are based on the most recent Mortgage that was taken out on this home.Purchase Details
Home Financials for this Owner
Home Financials are based on the most recent Mortgage that was taken out on this home.Purchase Details
Purchase History
We collect this data history from publicly available records. To have your information removed, we recommend requesting removal directly through your county’s website.
| Date | Buyer | Sale Price | Title Company |
|---|---|---|---|
| $290,000 | First American Title | ||
| $281,000 | First American Title | ||
| $297,500 | First American Title |
Mortgage History
We collect this data history from publicly available records. To have your information removed, we recommend requesting removal directly through your county’s website.
| Date | Status | Borrower | Loan Amount |
|---|---|---|---|
| Open | $232,000 | ||
| Previous Owner | $274,928 |
Tax History
We collect this data history from publicly available records. To have your information removed, we recommend requesting removal directly through your county’s website.
| Year | Tax Paid | Tax Assessment Tax Assessment Total Assessment is a certain percentage of the fair market value that is determined by local assessors to be the total taxable value of land and additions on the property. | Land | Improvement |
|---|---|---|---|---|
| 2026 | $5,364 | $692,845 | $223,080 | $469,765 |
| 2025 | $5,461 | $707,545 | $223,080 | $484,465 |
| 2023 | $5,461 | $606,300 | $223,080 | $383,220 |
| 2022 | $5,766 | $664,095 | $121,605 | $542,490 |
| 2021 | $4,360 | $664,095 | $121,605 | $542,490 |
| 2020 | $4,245 | $470,010 | $121,605 | $348,405 |
| 2018 | $3,996 | $347,440 | $116,175 | $231,265 |
| 2017 | $3,675 | $347,255 | $115,990 | $231,265 |
| 2016 | $2,843 | $332,930 | $108,400 | $224,530 |
| 2015 | $2,876 | $255,925 | $117,000 | $138,925 |
| 2014 | -- | $255,925 | $117,000 | $138,925 |
| 2013 | -- | $255,925 | $117,000 | $138,925 |
Map
- 0 TR 3 E Mason Lake Rd
- 0 TR 4 E Mason Lake Rd
- 200 E Roos Ct
- 380 E Benson Lake Rd
- 381 E Benson Ridge Rd
- 1961 E Mason Lake Dr E
- 2851 E Mason Lake Dr E
- 5530 E Mason Lake Dr W
- 430 E Olympic Dr
- 350 E Olympic Dr
- 4311 E Mason Lake Dr W
- 220 E Olympic Dr
- 90 E Lakeview Dr
- 3800 E Mason Lake Dr W
- 0 E Savage Ln
- 42 E Mossflower Ln
- 1870 E Mason Lake Dr W
- 1210 E Mason Lake Dr S
- 110 E Glacier Crest Rd
- 100 E Twanoh Heights Rd S
- 1210 E Benson Lake Rd
- 1190 E Benson Lake Dr
- 1240 E Benson Lake Dr
- 1170 E Benson Lake Dr
- 1260 E Benson Lake Dr
- 1160 E Benson Lake Dr
- 1280 E Benson Lake Dr
- 1150 E Benson Lake Dr
- 1310 E Benson Lake Dr
- 1140 E Benson Lake Dr
- 1130 E Benson Lake Dr
- 1350 E Benson Lake Dr
- 1301 E Benson Lake Dr
- 1271 E Benson Lake Dr
- 1271 E Benson Lake Rd
- 1370 E Benson Lake Dr
- 1110 E Benson Lake Dr
- 28 Benson Lake Dr
- 1090 E Benson Lake Dr
- 1390 E Benson Lake Dr
Ask me questions while you tour the home.