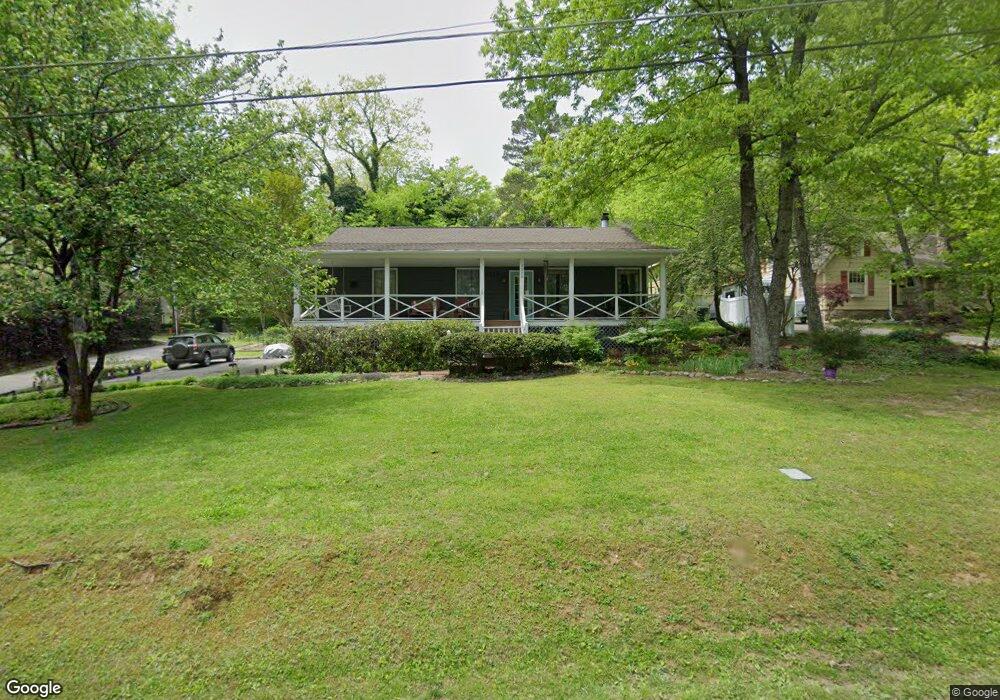
1210 Elfin Rd Lookout Mountain, GA 30750
Estimated Value: $400,957 - $513,000
3
Beds
2
Baths
1,450
Sq Ft
$316/Sq Ft
Est. Value
About This Home
This home is located at 1210 Elfin Rd, Lookout Mountain, GA 30750 and is currently estimated at $458,739, approximately $316 per square foot. 1210 Elfin Rd is a home located in Walker County with nearby schools including Fairyland Elementary School, Chattanooga Valley Middle School, and Ridgeland High School.
Ownership History
Date
Name
Owned For
Owner Type
Purchase Details
Closed on
Aug 24, 2004
Sold by
Hilger Edwin D and Wf Carlee J
Bought by
Chandler Chandler W and Chandler Hayes D
Current Estimated Value
Purchase Details
Closed on
Mar 10, 2000
Sold by
Touchstone Scott
Bought by
Hilger Edwin D and Wf Carlee J
Purchase Details
Closed on
Sep 20, 1999
Sold by
Hare Scott H
Bought by
Touchstone Scott
Purchase Details
Closed on
Jul 30, 1996
Sold by
Thatcher John Michael and Thatcher Clair
Bought by
Hare Scott H
Purchase Details
Closed on
Jul 29, 1994
Sold by
Trotter Mary Moore Bryan
Bought by
Thatcher John Michael and Thatcher Clair
Purchase Details
Closed on
Oct 31, 1986
Sold by
Mary John B and Mary Bryan
Bought by
Trotter Mary Moore Bryan
Purchase Details
Closed on
Jan 1, 1972
Bought by
Mary John B and Mary Bryan
Create a Home Valuation Report for This Property
The Home Valuation Report is an in-depth analysis detailing your home's value as well as a comparison with similar homes in the area
Home Values in the Area
Average Home Value in this Area
Purchase History
| Date | Buyer | Sale Price | Title Company |
|---|---|---|---|
| Chandler Chandler W | $160,000 | -- | |
| Hilger Edwin D | $134,000 | -- | |
| Touchstone Scott | $124,000 | -- | |
| Hare Scott H | $115,000 | -- | |
| Thatcher John Michael | $96,000 | -- | |
| Trotter Mary Moore Bryan | -- | -- | |
| Mary John B | -- | -- |
Source: Public Records
Tax History Compared to Growth
Tax History
| Year | Tax Paid | Tax Assessment Tax Assessment Total Assessment is a certain percentage of the fair market value that is determined by local assessors to be the total taxable value of land and additions on the property. | Land | Improvement |
|---|---|---|---|---|
| 2024 | $4,505 | $144,278 | $34,604 | $109,674 |
| 2023 | $4,350 | $138,365 | $34,604 | $103,761 |
| 2022 | $2,686 | $104,040 | $25,953 | $78,087 |
| 2021 | $2,216 | $77,450 | $22,493 | $54,957 |
| 2020 | $1,946 | $65,433 | $22,493 | $42,940 |
| 2019 | $1,947 | $65,433 | $22,493 | $42,940 |
| 2018 | $1,947 | $65,433 | $22,493 | $42,940 |
| 2017 | $2,116 | $65,433 | $22,493 | $42,940 |
| 2016 | $1,749 | $65,433 | $22,493 | $42,940 |
| 2015 | $1,568 | $56,195 | $14,084 | $42,111 |
| 2014 | $1,510 | $56,195 | $14,084 | $42,111 |
| 2013 | -- | $56,194 | $14,084 | $42,110 |
Source: Public Records
Map
Nearby Homes
- 1300 Elfin Rd
- 1211 Cinderella Rd
- 302 Mcfarland Rd
- 401 Mcfarland Rd
- 0 Fleetwood Dr Unit RTC2957879
- 0 Fleetwood Dr Unit 1517351
- 0 Tinker Bell Cir Unit LOT 27 10563269
- 0 Tinker Bell Cir Unit 1510010
- 219 Gnome Trail
- 891 Fleetwood Dr
- 1601 Wood Nymph Trail
- 1613 Fairy Dell Trail
- 504 Fleetwood Dr
- 196 Fort Stephenson Place
- 1007 Evanwood Dr
- 1709 Wood Nymph Trail
- 118 Fleetwood Dr
- 105 N Forrest Ave
- 5720 Saint Elmo Ave
- 5601 Alabama Ave
- 1208 Elfin Rd
- 203 Oberon Trail
- 1209 Elfin Rd
- 202 Oberon Trail
- 1212 Elfin Rd
- 1208 Cinderella Rd
- 205 Oberon Trail
- 1214 Elfin Rd
- 203 Red Riding Hood Trail
- 1200 Elfin Rd
- 1207 Elfin Rd
- 1215 Elfin Rd
- 212 Pied Piper Trail
- 205 Red Riding Hood Trail
- 206 Pied Piper St
- 206 Oberon Trail
- 1205 Lula Lake Rd
- 214 Pied Piper Trail
- 1206 Cinderella Rd
- 1205 Elfin Rd