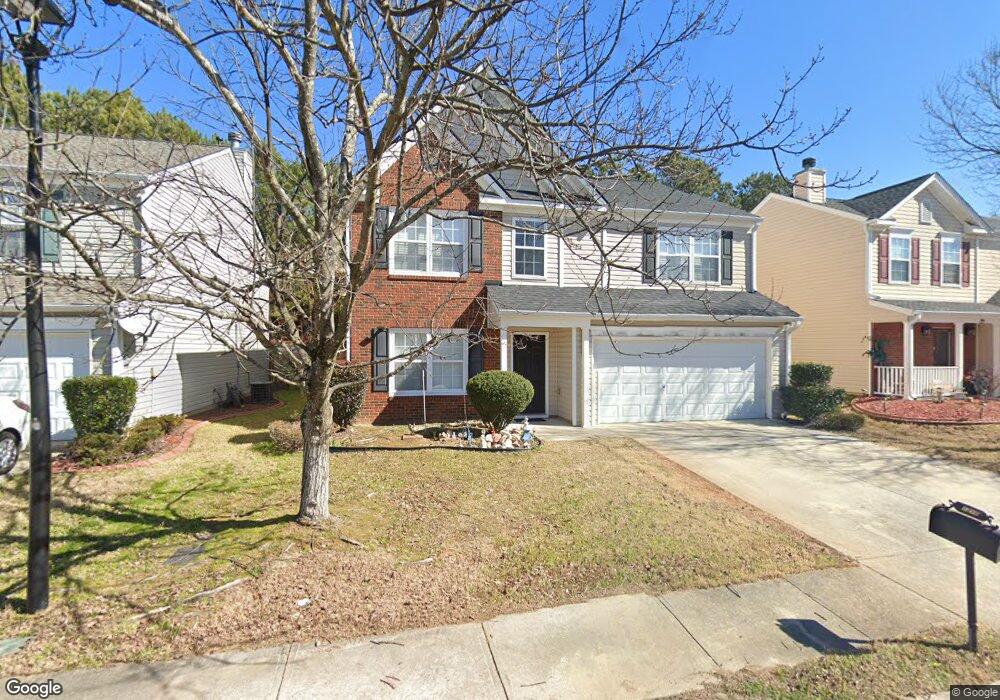
1210 Matt Moore Ct Lithia Springs, GA 30122
Lithia Springs NeighborhoodEstimated Value: $293,000 - $378,000
5
Beds
3
Baths
2,226
Sq Ft
$149/Sq Ft
Est. Value
About This Home
This home is located at 1210 Matt Moore Ct, Lithia Springs, GA 30122 and is currently estimated at $332,349, approximately $149 per square foot. 1210 Matt Moore Ct is a home located in Douglas County with nearby schools including Lithia Springs Elementary School, Turner Middle School, and Lithia Springs Comprehensive High School.
Ownership History
Date
Name
Owned For
Owner Type
Purchase Details
Closed on
Oct 7, 2011
Sold by
Federal Home Loan Mortgage Corporation
Bought by
Lopez Floridalma
Current Estimated Value
Home Financials for this Owner
Home Financials are based on the most recent Mortgage that was taken out on this home.
Original Mortgage
$82,000
Outstanding Balance
$56,196
Interest Rate
4.2%
Mortgage Type
New Conventional
Estimated Equity
$276,153
Purchase Details
Closed on
Feb 1, 2011
Sold by
Wells Fargo Bk Na
Bought by
Federal Home Loan Mortgage Corporation
Purchase Details
Closed on
Nov 21, 2003
Sold by
Colony Homes Llc
Bought by
Nkwocha Felix and Nkwocha Chinyere
Home Financials for this Owner
Home Financials are based on the most recent Mortgage that was taken out on this home.
Original Mortgage
$117,088
Interest Rate
5.82%
Mortgage Type
New Conventional
Create a Home Valuation Report for This Property
The Home Valuation Report is an in-depth analysis detailing your home's value as well as a comparison with similar homes in the area
Home Values in the Area
Average Home Value in this Area
Purchase History
| Date | Buyer | Sale Price | Title Company |
|---|---|---|---|
| Lopez Floridalma | -- | -- | |
| Federal Home Loan Mortgage Corporation | -- | -- | |
| Wells Fargo Bk Na | $80,000 | -- | |
| Nkwocha Felix | $146,400 | -- |
Source: Public Records
Mortgage History
| Date | Status | Borrower | Loan Amount |
|---|---|---|---|
| Open | Lopez Floridalma | $82,000 | |
| Previous Owner | Nkwocha Felix | $117,088 |
Source: Public Records
Tax History Compared to Growth
Tax History
| Year | Tax Paid | Tax Assessment Tax Assessment Total Assessment is a certain percentage of the fair market value that is determined by local assessors to be the total taxable value of land and additions on the property. | Land | Improvement |
|---|---|---|---|---|
| 2024 | $4,102 | $128,320 | $24,960 | $103,360 |
| 2023 | $4,102 | $128,320 | $24,960 | $103,360 |
| 2022 | $3,368 | $101,440 | $21,280 | $80,160 |
| 2021 | $2,309 | $68,800 | $12,120 | $56,680 |
| 2020 | $2,338 | $68,800 | $12,120 | $56,680 |
| 2019 | $2,138 | $67,240 | $12,120 | $55,120 |
| 2018 | $1,828 | $56,960 | $10,640 | $46,320 |
| 2017 | $1,689 | $51,480 | $10,640 | $40,840 |
| 2016 | $1,632 | $48,840 | $10,520 | $38,320 |
| 2015 | $1,211 | $41,920 | $9,280 | $32,640 |
| 2014 | $1,211 | $34,360 | $8,160 | $26,200 |
| 2013 | -- | $33,560 | $8,040 | $25,520 |
Source: Public Records
Map
Nearby Homes
- 0 Vulcan Dr Unit 10471332
- 0 Vulcan Dr Unit 7530603
- 2741 Groovers Lake Point
- 2683 Jordan Ln
- 2694 Jordan Ln
- 2694 Jordan Ln Unit 23
- 2623 Jordan Ln
- 2693 Jordan Ln
- Bradley Plan at The View at Groover's Lake - Georgian Series
- Wisteria Plan at The View at Groover's Lake - Georgian Series
- Bayberry Plan at The View at Groover's Lake - Georgian Series
- Redbud Plan at The View at Groover's Lake - Georgian Series
- 0 W Lake Vulcan Dr Unit 10587241
- 7315 Lee Rd
- 7814 Messina Ct
- 8816 Sibella Ct
- 7104 Miller St
- 3403 Linda Dr
- 3245 W Anderson Dr
- 3017 Bellingham Way
- 1212 Matt Moore Ct Unit 1
- 1208 Matt Moore Ct
- 1217 Andrews Dr
- 1215 Andrews Dr Unit 102
- 1215 Andrews Dr
- 1202 Matt Moore Ct
- 1214 Matt Moore Ct Unit 1
- 1213 Andrews Dr Unit 1
- 1205 Matt Moore Ct
- 1207 Matt Moore Ct
- 1219 Andrews Dr
- 1203 Matt Moore Ct
- 1200 Matt Moore Ct
- 1209 Matt Moore Ct Unit 1
- 1216 Matt Moore Ct
- 1211 Andrews Dr
- 1211 Andrews Dr Unit I
- 1201 Matt Moore Ct
- 1211 Matt Moore Ct Unit 1
- 1221 Andrews Dr