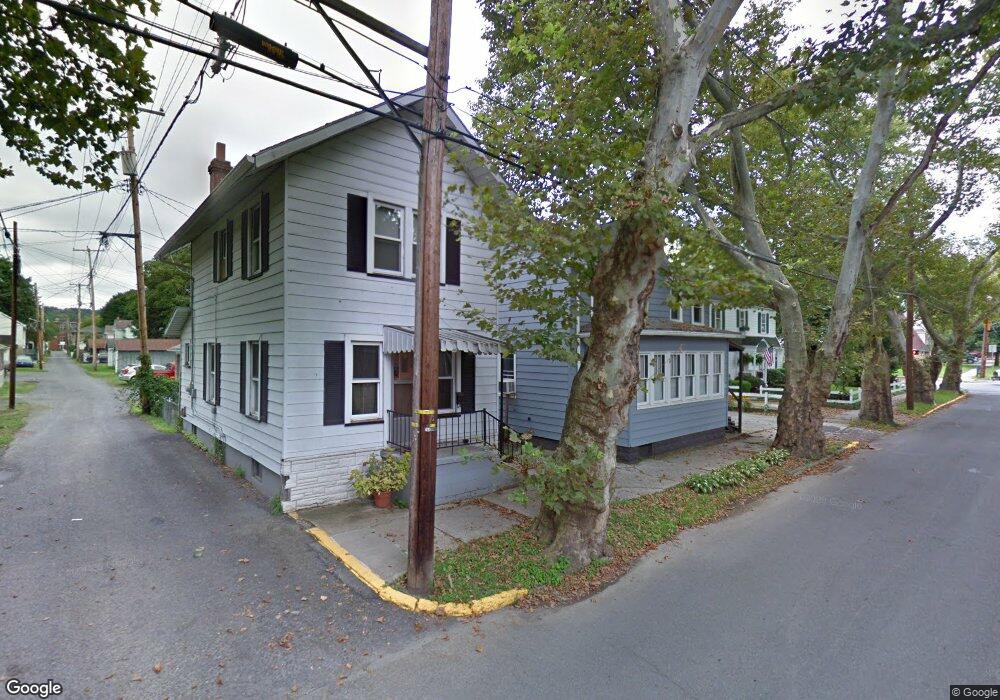
1210 Moore St Huntingdon, PA 16652
Estimated Value: $53,238 - $135,000
3
Beds
2
Baths
1,050
Sq Ft
$93/Sq Ft
Est. Value
About This Home
This home is located at 1210 Moore St, Huntingdon, PA 16652 and is currently estimated at $97,810, approximately $93 per square foot. 1210 Moore St is a home located in Huntingdon County with nearby schools including Huntingdon Area Senior High School, New Day Charter School, and Calvary Christian Academy.
Ownership History
Date
Name
Owned For
Owner Type
Purchase Details
Closed on
Aug 24, 2007
Sold by
Rivello Jenette Marie and Herncane Corey S
Bought by
Beale Jason L
Current Estimated Value
Purchase Details
Closed on
Jul 26, 2006
Sold by
Hanlon Casey J and Hanlon Nicole
Bought by
Rivello Jenette Marie
Home Financials for this Owner
Home Financials are based on the most recent Mortgage that was taken out on this home.
Original Mortgage
$59,529
Interest Rate
6.8%
Mortgage Type
FHA
Create a Home Valuation Report for This Property
The Home Valuation Report is an in-depth analysis detailing your home's value as well as a comparison with similar homes in the area
Home Values in the Area
Average Home Value in this Area
Purchase History
| Date | Buyer | Sale Price | Title Company |
|---|---|---|---|
| Beale Jason L | $65,000 | None Available | |
| Rivello Jenette Marie | $60,000 | None Available |
Source: Public Records
Mortgage History
| Date | Status | Borrower | Loan Amount |
|---|---|---|---|
| Previous Owner | Rivello Jenette Marie | $59,529 |
Source: Public Records
Tax History Compared to Growth
Tax History
| Year | Tax Paid | Tax Assessment Tax Assessment Total Assessment is a certain percentage of the fair market value that is determined by local assessors to be the total taxable value of land and additions on the property. | Land | Improvement |
|---|---|---|---|---|
| 2024 | $458 | $4,560 | $1,520 | $3,040 |
| 2023 | $417 | $4,560 | $1,520 | $3,040 |
| 2022 | $409 | $4,560 | $1,520 | $3,040 |
| 2021 | $398 | $4,560 | $1,520 | $3,040 |
| 2020 | $391 | $4,560 | $1,520 | $3,040 |
| 2019 | $368 | $4,560 | $1,520 | $3,040 |
| 2018 | $362 | $4,560 | $1,520 | $3,040 |
| 2017 | $346 | $4,560 | $1,520 | $3,040 |
| 2016 | $33 | $4,560 | $1,520 | $3,040 |
| 2015 | $328 | $4,560 | $1,520 | $3,040 |
| 2014 | -- | $4,560 | $1,520 | $3,040 |
Source: Public Records
Map
Nearby Homes