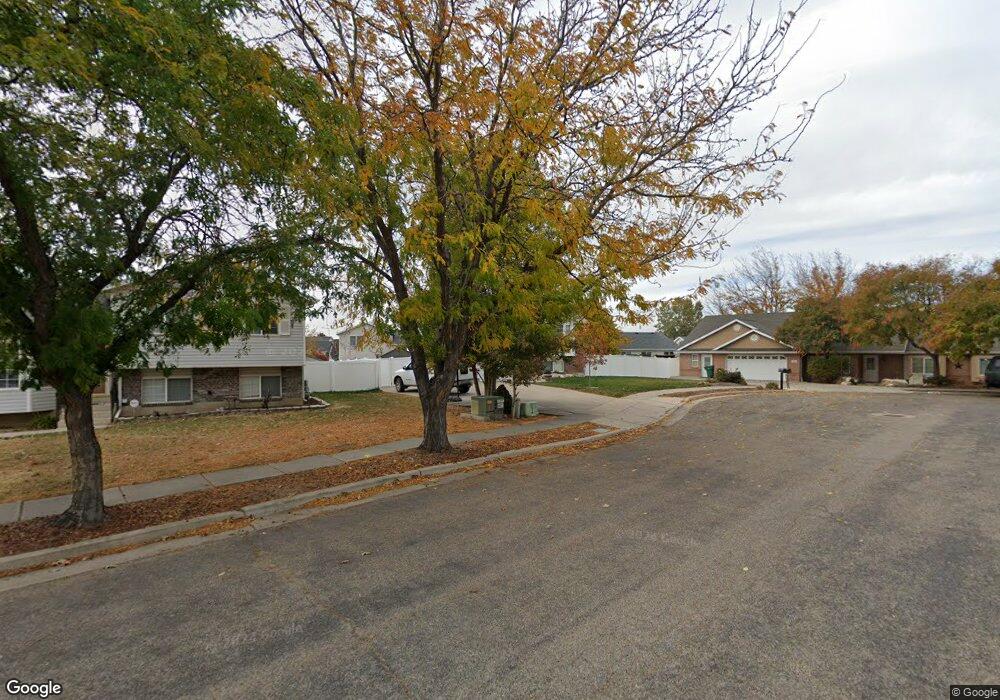
1210 N 450 W Clearfield, UT 84015
Estimated Value: $375,477 - $397,000
4
Beds
2
Baths
1,107
Sq Ft
$350/Sq Ft
Est. Value
About This Home
This home is located at 1210 N 450 W, Clearfield, UT 84015 and is currently estimated at $387,869, approximately $350 per square foot. 1210 N 450 W is a home located in Davis County with nearby schools including Doxey School, Sunset Junior High School, and Northridge High School.
Ownership History
Date
Name
Owned For
Owner Type
Purchase Details
Closed on
Feb 6, 2024
Sold by
Cook Bruce William
Bought by
Cook Bruce William and Cook Frank Carl
Current Estimated Value
Home Financials for this Owner
Home Financials are based on the most recent Mortgage that was taken out on this home.
Original Mortgage
$305,600
Outstanding Balance
$299,899
Interest Rate
6.61%
Mortgage Type
New Conventional
Estimated Equity
$87,970
Purchase Details
Closed on
Dec 1, 2020
Sold by
Petersen Jeffrey
Bought by
Petersen Heidi and Pelersen Jeffrey
Purchase Details
Closed on
Feb 21, 2001
Sold by
Cook Bruce William and Cook Leann
Bought by
Cook Bruce William and Cook Leann
Purchase Details
Closed on
Jan 12, 2000
Sold by
Cook Bruce William
Bought by
Cook Bruce William and Cook Leann
Create a Home Valuation Report for This Property
The Home Valuation Report is an in-depth analysis detailing your home's value as well as a comparison with similar homes in the area
Home Values in the Area
Average Home Value in this Area
Purchase History
| Date | Buyer | Sale Price | Title Company |
|---|---|---|---|
| Cook Bruce William | -- | None Listed On Document | |
| Petersen Heidi | -- | North American Title | |
| Cook Bruce William | -- | Us Title | |
| Cook Bruce William | -- | Us Title |
Source: Public Records
Mortgage History
| Date | Status | Borrower | Loan Amount |
|---|---|---|---|
| Open | Cook Bruce William | $305,600 |
Source: Public Records
Tax History Compared to Growth
Tax History
| Year | Tax Paid | Tax Assessment Tax Assessment Total Assessment is a certain percentage of the fair market value that is determined by local assessors to be the total taxable value of land and additions on the property. | Land | Improvement |
|---|---|---|---|---|
| 2025 | $2,285 | $208,450 | $72,885 | $135,565 |
| 2024 | $2,152 | $196,350 | $69,677 | $126,673 |
| 2023 | $2,032 | $338,000 | $111,447 | $226,553 |
| 2022 | $2,169 | $195,250 | $63,875 | $131,375 |
| 2021 | $1,852 | $262,000 | $68,064 | $193,936 |
| 2020 | $1,617 | $225,000 | $57,289 | $167,711 |
| 2019 | $1,478 | $211,000 | $74,017 | $136,983 |
| 2018 | $1,324 | $185,000 | $59,151 | $125,849 |
| 2016 | $1,180 | $84,700 | $27,963 | $56,737 |
| 2015 | $1,094 | $74,415 | $27,963 | $46,452 |
| 2014 | $1,074 | $74,656 | $28,159 | $46,497 |
| 2013 | -- | $72,035 | $23,265 | $48,770 |
Source: Public Records
Map
Nearby Homes