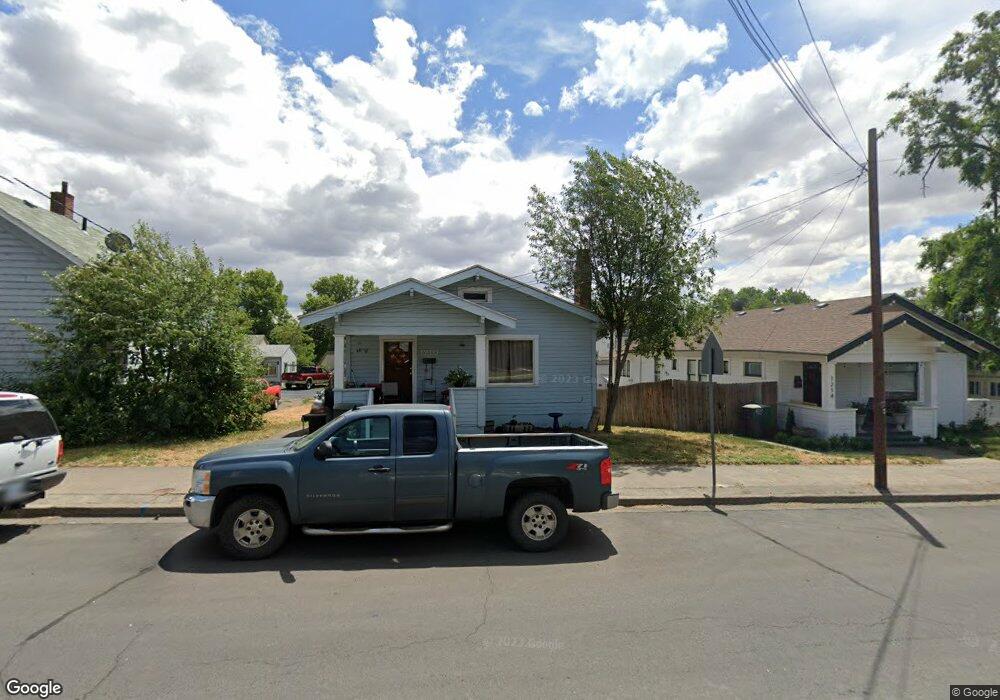
1210 NW Carden Ave Pendleton, OR 97801
Estimated Value: $247,000 - $303,000
2
Beds
1
Bath
2,112
Sq Ft
$130/Sq Ft
Est. Value
About This Home
This home is located at 1210 NW Carden Ave, Pendleton, OR 97801 and is currently estimated at $273,757, approximately $129 per square foot. 1210 NW Carden Ave is a home located in Umatilla County with nearby schools including Washington Elementary School, Sunridge Middle School, and Pendleton High School.
Ownership History
Date
Name
Owned For
Owner Type
Purchase Details
Closed on
Mar 26, 2015
Sold by
Cochran Timothy J and Cochran Rena I
Bought by
Joseph Kellen
Current Estimated Value
Home Financials for this Owner
Home Financials are based on the most recent Mortgage that was taken out on this home.
Original Mortgage
$101,750
Outstanding Balance
$77,986
Interest Rate
3.62%
Mortgage Type
FHA
Estimated Equity
$195,771
Purchase Details
Closed on
Jan 29, 2009
Sold by
Cochran Timothy J
Bought by
Cochran Timothy J and Cochran Rena I
Home Financials for this Owner
Home Financials are based on the most recent Mortgage that was taken out on this home.
Original Mortgage
$110,391
Interest Rate
5.14%
Mortgage Type
FHA
Purchase Details
Closed on
May 17, 2007
Sold by
Shaw Daniel Herbert and Shaw Daniel Herbert
Bought by
Cochran Timothy J
Home Financials for this Owner
Home Financials are based on the most recent Mortgage that was taken out on this home.
Original Mortgage
$103,000
Interest Rate
6.17%
Mortgage Type
New Conventional
Create a Home Valuation Report for This Property
The Home Valuation Report is an in-depth analysis detailing your home's value as well as a comparison with similar homes in the area
Home Values in the Area
Average Home Value in this Area
Purchase History
| Date | Buyer | Sale Price | Title Company |
|---|---|---|---|
| Joseph Kellen | $107,000 | Amerititle | |
| Cochran Timothy J | -- | Pioneer Title Co | |
| Cochran Timothy J | $103,000 | Amerititle |
Source: Public Records
Mortgage History
| Date | Status | Borrower | Loan Amount |
|---|---|---|---|
| Open | Joseph Kellen | $101,750 | |
| Previous Owner | Cochran Timothy J | $110,391 | |
| Previous Owner | Cochran Timothy J | $103,000 |
Source: Public Records
Tax History Compared to Growth
Tax History
| Year | Tax Paid | Tax Assessment Tax Assessment Total Assessment is a certain percentage of the fair market value that is determined by local assessors to be the total taxable value of land and additions on the property. | Land | Improvement |
|---|---|---|---|---|
| 2022 | $1,987 | $109,850 | $0 | $0 |
| 2021 | $1,846 | $98,540 | $33,780 | $64,760 |
| 2020 | $1,783 | $95,670 | $32,790 | $62,880 |
| 2018 | $1,733 | $90,190 | $30,910 | $59,280 |
| 2017 | $1,692 | $87,570 | $30,010 | $57,560 |
| 2016 | $1,598 | $85,020 | $29,140 | $55,880 |
| 2015 | $1,599 | $77,820 | $26,670 | $51,150 |
| 2014 | $1,531 | $77,820 | $26,670 | $51,150 |
Source: Public Records
Map
Nearby Homes
- 1214 NW Carden Ave
- 127 NW 12th St
- 127 & 133 Nw 12th St
- 1208 NW Carden Ave
- 1226 NW Carden Ave
- 1204 NW Carden Ave
- 121 NW 12th St
- 1209 NW Carden Ave
- 1215 NW Carden Ave
- 1207 NW Carden Ave
- 115 NW 12th St
- 1201 NW Carden Ave
- 1114 NW Carden Ave
- 212 NW 13th St
- 1303 NW Carden Ave
- 211 NW 12th St
- 1113 NW Carden Ave
- 116 NW 12th St
- 1110 NW Carden Ave
- 216 NW 13th St