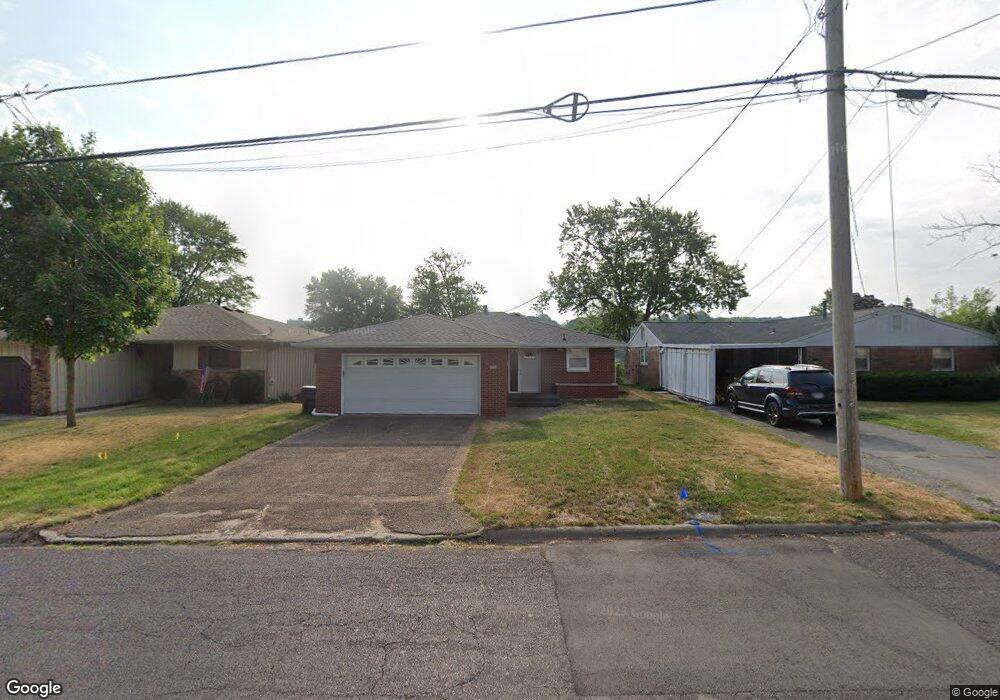
1210 S 18th St Pekin, IL 61554
South of Broadway NeighborhoodEstimated Value: $139,000 - $286,000
2
Beds
2
Baths
1,160
Sq Ft
$165/Sq Ft
Est. Value
About This Home
This home is located at 1210 S 18th St, Pekin, IL 61554 and is currently estimated at $191,639, approximately $165 per square foot. 1210 S 18th St is a home located in Tazewell County with nearby schools including Wilson Intermediate School, Dirksen Elementary School, and Broadmoor Junior High School.
Ownership History
Date
Name
Owned For
Owner Type
Purchase Details
Closed on
Sep 5, 2013
Sold by
Krakel Carl
Bought by
Denbraber Lee R and Denbraber Monica L
Current Estimated Value
Home Financials for this Owner
Home Financials are based on the most recent Mortgage that was taken out on this home.
Original Mortgage
$108,000
Outstanding Balance
$80,497
Interest Rate
4.37%
Mortgage Type
New Conventional
Estimated Equity
$111,142
Create a Home Valuation Report for This Property
The Home Valuation Report is an in-depth analysis detailing your home's value as well as a comparison with similar homes in the area
Home Values in the Area
Average Home Value in this Area
Purchase History
| Date | Buyer | Sale Price | Title Company |
|---|---|---|---|
| Denbraber Lee R | $135,000 | First Community Title Svcs |
Source: Public Records
Mortgage History
| Date | Status | Borrower | Loan Amount |
|---|---|---|---|
| Open | Denbraber Lee R | $108,000 |
Source: Public Records
Tax History Compared to Growth
Tax History
| Year | Tax Paid | Tax Assessment Tax Assessment Total Assessment is a certain percentage of the fair market value that is determined by local assessors to be the total taxable value of land and additions on the property. | Land | Improvement |
|---|---|---|---|---|
| 2024 | $5,687 | $66,840 | $16,970 | $49,870 |
| 2023 | $5,687 | $62,070 | $15,760 | $46,310 |
| 2022 | $5,349 | $57,880 | $14,700 | $43,180 |
| 2021 | $4,976 | $53,800 | $14,010 | $39,790 |
| 2020 | $4,931 | $53,800 | $14,010 | $39,790 |
| 2019 | $4,862 | $53,800 | $14,010 | $39,790 |
| 2018 | $4,210 | $53,800 | $14,010 | $39,790 |
| 2017 | $4,011 | $52,770 | $13,880 | $38,890 |
| 2016 | $3,926 | $51,720 | $13,600 | $38,120 |
| 2015 | $3,809 | $0 | $0 | $0 |
| 2013 | $3,409 | $52,810 | $13,600 | $39,210 |
Source: Public Records
Map
Nearby Homes