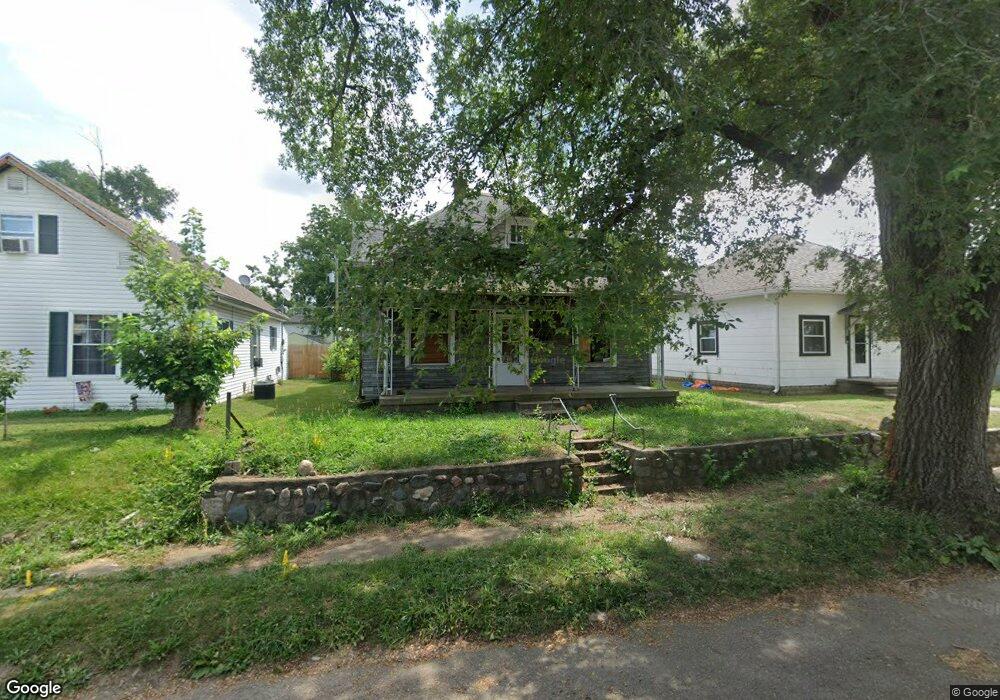
1210 S 19th St New Castle, IN 47362
Estimated Value: $92,052 - $113,000
3
Beds
2
Baths
1,800
Sq Ft
$58/Sq Ft
Est. Value
About This Home
This home is located at 1210 S 19th St, New Castle, IN 47362 and is currently estimated at $104,763, approximately $58 per square foot. 1210 S 19th St is a home located in Henry County with nearby schools including Agape Learning Center.
Ownership History
Date
Name
Owned For
Owner Type
Purchase Details
Closed on
Jan 10, 2023
Sold by
Auditor Debra G Walker
Bought by
Alex H Llc
Current Estimated Value
Purchase Details
Closed on
Oct 7, 2019
Sold by
Donna Saylor
Bought by
Smith Benjamin
Purchase Details
Closed on
Jul 8, 2016
Sold by
Fspi Empi Profit Sharing Plan 401
Bought by
Saylor Donna
Purchase Details
Closed on
Sep 15, 2014
Sold by
Auditor Of Henry County
Bought by
Fspi Employee Profit Sharing P
Create a Home Valuation Report for This Property
The Home Valuation Report is an in-depth analysis detailing your home's value as well as a comparison with similar homes in the area
Home Values in the Area
Average Home Value in this Area
Purchase History
| Date | Buyer | Sale Price | Title Company |
|---|---|---|---|
| Alex H Llc | $1,325 | Henry County Auditors Office | |
| Smith Benjamin | $1,133 | None Available | |
| Saylor Donna | -- | None Available | |
| Fspi Employee Profit Sharing P | $1,000 | -- |
Source: Public Records
Tax History Compared to Growth
Tax History
| Year | Tax Paid | Tax Assessment Tax Assessment Total Assessment is a certain percentage of the fair market value that is determined by local assessors to be the total taxable value of land and additions on the property. | Land | Improvement |
|---|---|---|---|---|
| 2024 | $306 | $15,300 | $7,100 | $8,200 |
| 2023 | $432 | $21,600 | $7,100 | $14,500 |
| 2022 | $352 | $17,600 | $4,700 | $12,900 |
| 2021 | $314 | $15,700 | $4,700 | $11,000 |
| 2020 | $540 | $15,200 | $4,700 | $10,500 |
| 2019 | $484 | $14,800 | $4,700 | $10,100 |
| 2018 | $942 | $14,100 | $4,300 | $9,800 |
| 2017 | $166 | $14,000 | $4,300 | $9,700 |
| 2016 | $171 | $16,400 | $5,000 | $11,400 |
| 2014 | $625 | $31,200 | $8,300 | $22,900 |
| 2013 | $625 | $30,100 | $8,300 | $21,800 |
Source: Public Records
Map
Nearby Homes