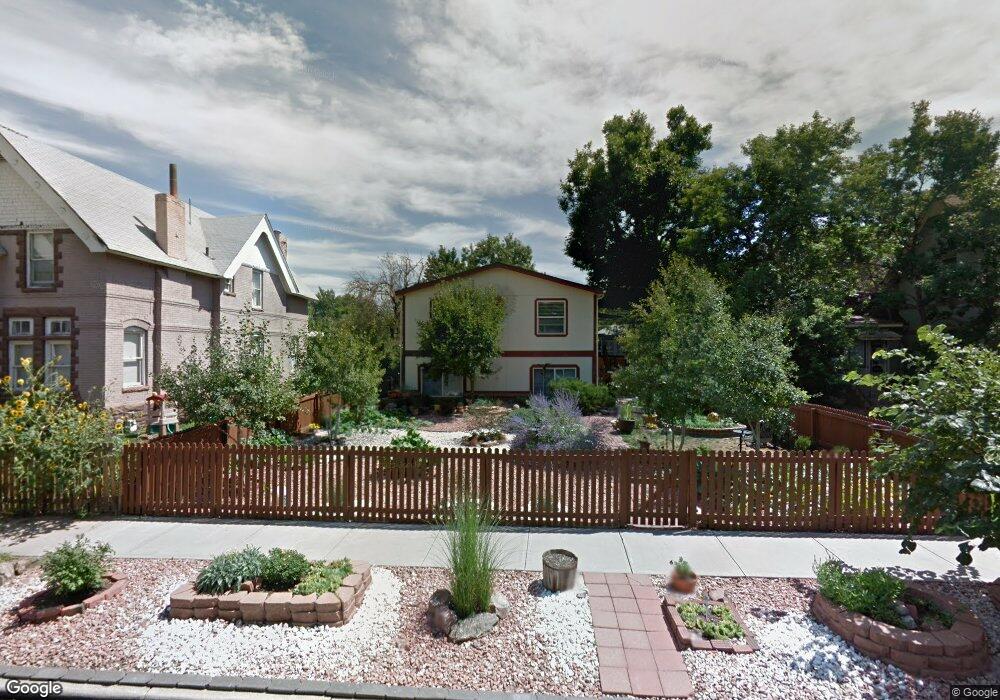
1210 S Sherman St Denver, CO 80210
Platt Park NeighborhoodEstimated Value: $1,043,000 - $1,114,412
5
Beds
4
Baths
3,069
Sq Ft
$351/Sq Ft
Est. Value
About This Home
This home is located at 1210 S Sherman St, Denver, CO 80210 and is currently estimated at $1,078,706, approximately $351 per square foot. 1210 S Sherman St is a home located in Denver County with nearby schools including McKinley-Thatcher Elementary School, Grant Beacon Middle School, and South High School.
Ownership History
Date
Name
Owned For
Owner Type
Purchase Details
Closed on
Dec 13, 2016
Sold by
West Mark Brandon and West Megan L Montgomery
Bought by
Hoy James R and Condon Kelly M
Current Estimated Value
Home Financials for this Owner
Home Financials are based on the most recent Mortgage that was taken out on this home.
Original Mortgage
$562,500
Outstanding Balance
$454,489
Interest Rate
3.54%
Mortgage Type
New Conventional
Estimated Equity
$624,217
Purchase Details
Closed on
Nov 12, 2004
Sold by
Newman Eleanor
Bought by
West Mark Brandon and West Megan L Montgomery
Home Financials for this Owner
Home Financials are based on the most recent Mortgage that was taken out on this home.
Original Mortgage
$356,250
Interest Rate
5.87%
Mortgage Type
Purchase Money Mortgage
Purchase Details
Closed on
Oct 29, 1999
Sold by
Williams Quent D
Bought by
Newman Eleanor
Purchase Details
Closed on
Mar 22, 1996
Sold by
Hill Timothy M
Bought by
Williams Quent D and Williams Bonnie M
Home Financials for this Owner
Home Financials are based on the most recent Mortgage that was taken out on this home.
Original Mortgage
$109,900
Interest Rate
6.92%
Create a Home Valuation Report for This Property
The Home Valuation Report is an in-depth analysis detailing your home's value as well as a comparison with similar homes in the area
Home Values in the Area
Average Home Value in this Area
Purchase History
| Date | Buyer | Sale Price | Title Company |
|---|---|---|---|
| Hoy James R | $750,000 | Heritage Title Co | |
| West Mark Brandon | $475,000 | Security Title | |
| Newman Eleanor | $195,000 | -- | |
| Williams Quent D | $60,500 | -- |
Source: Public Records
Mortgage History
| Date | Status | Borrower | Loan Amount |
|---|---|---|---|
| Open | Hoy James R | $562,500 | |
| Previous Owner | West Mark Brandon | $356,250 | |
| Previous Owner | Williams Quent D | $109,900 |
Source: Public Records
Tax History Compared to Growth
Tax History
| Year | Tax Paid | Tax Assessment Tax Assessment Total Assessment is a certain percentage of the fair market value that is determined by local assessors to be the total taxable value of land and additions on the property. | Land | Improvement |
|---|---|---|---|---|
| 2024 | $5,014 | $63,310 | $40,010 | $23,300 |
| 2023 | $4,906 | $63,310 | $40,010 | $23,300 |
| 2022 | $4,572 | $57,490 | $36,960 | $20,530 |
| 2021 | $4,511 | $60,450 | $38,860 | $21,590 |
| 2020 | $4,276 | $57,630 | $31,090 | $26,540 |
| 2019 | $4,156 | $57,630 | $31,090 | $26,540 |
| 2018 | $3,899 | $50,400 | $26,420 | $23,980 |
| 2017 | $3,888 | $50,400 | $26,420 | $23,980 |
| 2016 | $3,127 | $38,350 | $18,388 | $19,962 |
| 2015 | $2,996 | $38,350 | $18,388 | $19,962 |
| 2014 | $2,539 | $30,570 | $13,484 | $17,086 |
Source: Public Records
Map
Nearby Homes
- 1209 S Pennsylvania St
- 1056 S Pennsylvania St
- 1355 S Pennsylvania St
- 1001 S Pennsylvania St Unit 1005
- 1144 S Cherokee St
- 969 S Pearl St Unit 204
- 1313 S Clarkson St Unit 305
- 1313 S Clarkson St Unit 405
- 1313 S Clarkson St Unit 202
- 1518 S Sherman St
- 838 S Sherman St
- 130 E Ohio Ave Unit 140
- 1260 S Emerson St
- 1023 S Emerson St
- 1127 S Ogden St
- 1626 S Sherman St
- 2121 S Galapago St
- 794 S Pearl St
- 1050 S Corona St
- 1650 S Pennsylvania St
- 1200 S Sherman St
- 1218 S Sherman St Unit 1220
- 1220 S Sherman St
- 1222 S Sherman St
- 1230 S Sherman St
- 1207 S Grant St
- 1211 S Grant St
- 1217 S Grant St
- 1201 S Grant St
- 1219 S Grant St
- 1236 S Sherman St
- 1211 S Sherman St
- 1215 S Sherman St
- 1225 S Sherman St
- 1219 S Sherman St
- 1229 S Grant St
- 1201 S Sherman St
- 1184 S Sherman St
- 1195 S Grant St
- 1229 S Sherman St