Estimated Value: $284,000 - $308,000
3
Beds
2
Baths
1,850
Sq Ft
$160/Sq Ft
Est. Value
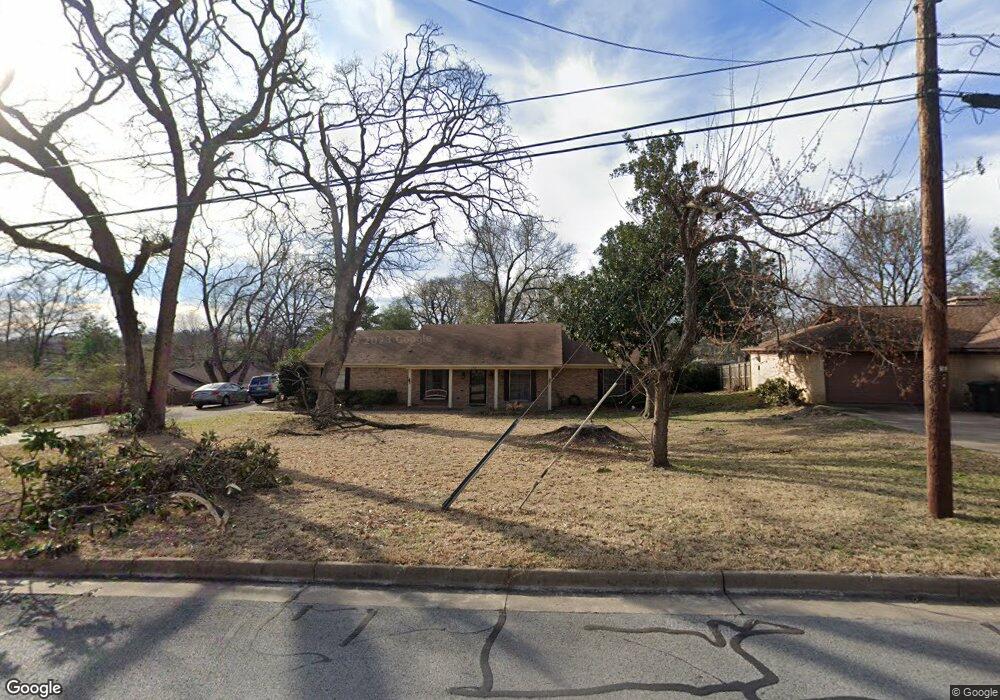
About This Home
This home is located at 1210 Woodland Hills Dr, Tyler, TX 75701 and is currently estimated at $296,227, approximately $160 per square foot. 1210 Woodland Hills Dr is a home located in Smith County with nearby schools including Woods Elementary School, Hubbard Middle School, and Tyler Legacy High School.
Ownership History
Date
Name
Owned For
Owner Type
Purchase Details
Closed on
Mar 14, 2016
Sold by
Brandon Ann
Bought by
Leblanc Yvonne Johnson and Leblanc Kevin P
Current Estimated Value
Home Financials for this Owner
Home Financials are based on the most recent Mortgage that was taken out on this home.
Original Mortgage
$153,133
Outstanding Balance
$120,824
Interest Rate
3.72%
Mortgage Type
FHA
Estimated Equity
$175,403
Purchase Details
Closed on
Nov 15, 2005
Sold by
Greller Christian and Soforo Kristi
Bought by
Brandon Ann
Home Financials for this Owner
Home Financials are based on the most recent Mortgage that was taken out on this home.
Original Mortgage
$58,000
Interest Rate
5.92%
Mortgage Type
Purchase Money Mortgage
Create a Home Valuation Report for This Property
The Home Valuation Report is an in-depth analysis detailing your home's value as well as a comparison with similar homes in the area
Home Values in the Area
Average Home Value in this Area
Purchase History
| Date | Buyer | Sale Price | Title Company |
|---|---|---|---|
| Leblanc Yvonne Johnson | -- | Ctc | |
| Brandon Ann | -- | None Available | |
| Brandon Ann | -- | None Available |
Source: Public Records
Mortgage History
| Date | Status | Borrower | Loan Amount |
|---|---|---|---|
| Open | Leblanc Yvonne Johnson | $153,133 | |
| Previous Owner | Brandon Ann | $58,000 |
Source: Public Records
Tax History Compared to Growth
Tax History
| Year | Tax Paid | Tax Assessment Tax Assessment Total Assessment is a certain percentage of the fair market value that is determined by local assessors to be the total taxable value of land and additions on the property. | Land | Improvement |
|---|---|---|---|---|
| 2025 | $2,773 | $341,033 | $117,974 | $223,059 |
| 2024 | $2,773 | $279,662 | $84,270 | $226,210 |
| 2023 | $4,432 | $315,595 | $84,270 | $231,325 |
| 2022 | $4,528 | $304,648 | $84,270 | $220,378 |
| 2021 | $4,408 | $225,014 | $48,154 | $176,860 |
| 2020 | $4,087 | $191,013 | $16,340 | $174,673 |
| 2019 | $3,899 | $178,289 | $16,340 | $161,949 |
| 2018 | $3,691 | $169,715 | $16,340 | $153,375 |
| 2017 | $3,623 | $169,715 | $16,340 | $153,375 |
| 2016 | $3,326 | $155,791 | $16,340 | $139,451 |
| 2015 | $2,089 | $150,207 | $16,340 | $133,867 |
| 2014 | $2,089 | $145,641 | $16,340 | $129,301 |
Source: Public Records
Map
Nearby Homes
- 1317 Woodland Hills Dr
- 3829 Cloverdale Dr
- 3915 Post Oak Rd
- 3518 Cloverdale Dr
- 3505 Cloverdale Dr
- 4001 Darrell Ln
- 3903 Appletree Ln
- 3501 Silverwood Dr
- 3606 Glendale Dr
- 3500 Silverwood Dr
- 1531 Woodland Hills Dr
- 3425 Iberville Dr
- 815 Woodland Hills Dr
- 3426 Bienville Dr
- 3413 Iberville Dr
- 3404 Silverwood Dr
- 701 Woodland Hills Dr
- 612 Rosemont Place II
- 3324 Teakwood Dr
- 604-606 Woodland Hills Dr
- 1210 1210 Woodland Hills
- 1218 Woodland Hills Dr
- 3811 3811 Cloverdale
- 3811 Cloverdale Dr
- 3810 Post Oak Rd
- 3801 Cloverdale Dr
- 1222 Woodland Hills Dr
- 1222 1222 Woodland Hills
- 3821 Cloverdale Dr
- 3810 3810 Post Oak Rd
- 1211 Woodland Hills Dr
- 1217 Woodland Hills Dr
- 3816 Post Oak Rd
- 1205 Woodland Hills Dr
- 1223 Woodland Hills Dr
- 3824 Post Oak Rd
- 3829 3829 Cloverdale Dr
- 3623 Cloverdale Dr
- 3623 3623 Cloverdale
- 1212 Kingsbury Dr