N
Seller's Agent in 2012
Neil Sullivan
Samson Properties

Estimated Value: $260,000 - $294,465
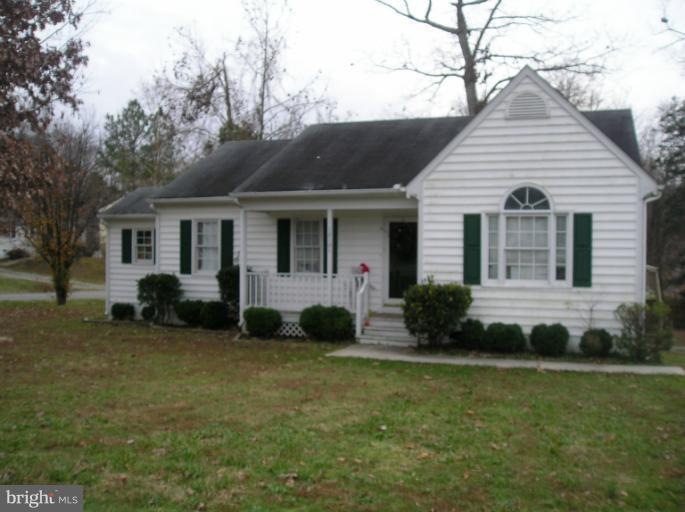
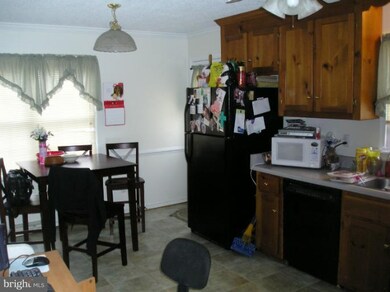
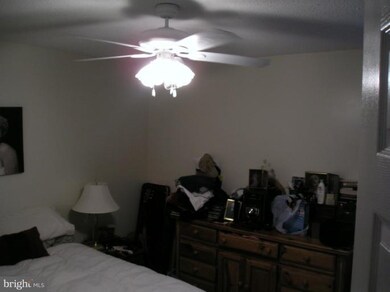
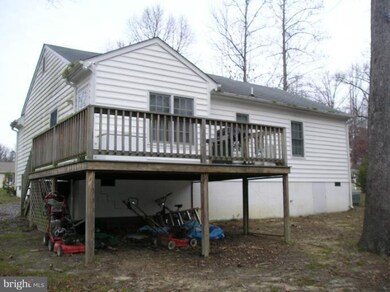
GREAT INVESTMENT OPPORTUNITY PRICE IS APPROVED Beautiful one level home in cul de sac with 3 bedrooms and 2 full baths. Spacious kitchen with eat in breakfast area which leads to deck and spacious lot.(Great for entertaining) Large family room with cathedral ceiling. Plenty of storage space with crawl space and attached shed.
Last Agent to Sell the Property
Neil Sullivan
nsulli4152@aol.com Samson Properties License #MRIS:84831 Listed on: 12/15/2011
Last Buyer's Agent
Non Member Member
beta@mris.net Metropolitan Regional Information Systems, Inc.
| Date | Buyer | Sale Price | Title Company |
|---|---|---|---|
| Nyquist Trentham Penny Lynn | -- | None Available | |
| Nyquist Frances E | $80,000 | -- | |
| Bennett Kimberly | $169,000 | -- | |
| Southern Jeanie M | $78,189 | -- |
| Date | Status | Borrower | Loan Amount |
|---|---|---|---|
| Open | Nyquist Frances E | $80,000 | |
| Previous Owner | Bennett Kimberly | $166,798 |
| Date | Event | Price | List to Sale | Price per Sq Ft |
|---|---|---|---|---|
| 11/27/2012 11/27/12 | Sold | $80,000 | 0.0% | $78 / Sq Ft |
| 10/09/2012 10/09/12 | Pending | -- | -- | -- |
| 09/26/2012 09/26/12 | Price Changed | $80,000 | -5.9% | $78 / Sq Ft |
| 09/26/2012 09/26/12 | Price Changed | $85,000 | -5.6% | $82 / Sq Ft |
| 09/21/2012 09/21/12 | For Sale | $90,000 | +12.5% | $87 / Sq Ft |
| 09/18/2012 09/18/12 | Off Market | $80,000 | -- | -- |
| 09/17/2012 09/17/12 | Price Changed | $90,000 | 0.0% | $87 / Sq Ft |
| 09/17/2012 09/17/12 | For Sale | $90,000 | +5.9% | $87 / Sq Ft |
| 07/06/2012 07/06/12 | Pending | -- | -- | -- |
| 06/26/2012 06/26/12 | Price Changed | $85,000 | 0.0% | $82 / Sq Ft |
| 06/26/2012 06/26/12 | For Sale | $85,000 | -26.1% | $82 / Sq Ft |
| 03/01/2012 03/01/12 | Pending | -- | -- | -- |
| 01/31/2012 01/31/12 | Price Changed | $115,000 | -4.2% | $111 / Sq Ft |
| 01/02/2012 01/02/12 | Price Changed | $120,000 | +33.5% | $116 / Sq Ft |
| 12/21/2011 12/21/11 | Price Changed | $89,900 | -10.1% | $87 / Sq Ft |
| 12/15/2011 12/15/11 | For Sale | $100,000 | -- | $97 / Sq Ft |
| Year | Tax Paid | Tax Assessment Tax Assessment Total Assessment is a certain percentage of the fair market value that is determined by local assessors to be the total taxable value of land and additions on the property. | Land | Improvement |
|---|---|---|---|---|
| 2025 | $2,270 | $252,200 | $55,000 | $197,200 |
| 2024 | $2,270 | $231,500 | $49,000 | $182,500 |
| 2023 | $1,863 | $204,700 | $47,000 | $157,700 |
| 2022 | $1,743 | $189,500 | $45,000 | $144,500 |
| 2021 | $1,658 | $169,700 | $43,000 | $126,700 |
| 2020 | $1,610 | $162,600 | $43,000 | $119,600 |
| 2019 | $1,484 | $156,200 | $41,000 | $115,200 |
| 2018 | $1,431 | $147,600 | $40,000 | $107,600 |
| 2017 | $1,410 | $141,700 | $38,000 | $103,700 |
| 2016 | $1,228 | $127,900 | $38,000 | $89,900 |
| 2015 | $1,237 | $126,200 | $38,000 | $88,200 |
| 2014 | $1,259 | $128,500 | $38,000 | $90,500 |
N
Seller's Agent in 2012
Neil Sullivan
Samson Properties
N
Buyer's Agent in 2012
Non Member Member
Metropolitan Regional Information Systems
Source: Bright MLS
MLS Number: 1005211761
APN: 739-67-69-27-600-000
Disclaimer: Certain information contained herein is derived from information provided by parties other than Homes.com. All information provided is deemed reliable, but is not guaranteed to be accurate and should be independently verified.
![]() The data relating to real estate for sale on this website appears in part through the BRIGHT Internet Data Exchange program, a voluntary cooperative exchange of property listing data between licensed real estate brokerage firms, and is provided by BRIGHT through a licensing agreement.
The data relating to real estate for sale on this website appears in part through the BRIGHT Internet Data Exchange program, a voluntary cooperative exchange of property listing data between licensed real estate brokerage firms, and is provided by BRIGHT through a licensing agreement.
Listing information is from various brokers who participate in the Bright MLS IDX program and not all listings may be visible on the site.
The property information being provided on or through the website is for the personal, non-commercial use of consumers and such information may not be used for any purpose other than to identify prospective properties consumers may be interested in purchasing.
Some properties which appear for sale on the website may no longer be available because they are for instance, under contract, sold or are no longer being offered for sale.
Property information displayed is deemed reliable but is not guaranteed.
Copyright 2025 Bright MLS, Inc.