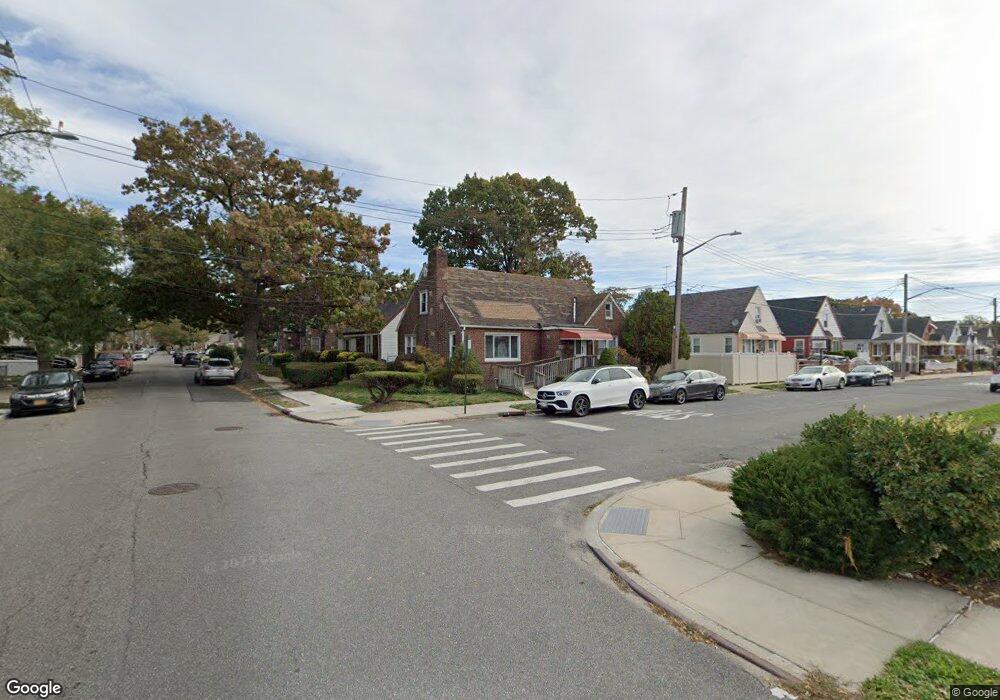
12105 Milburn St Springfield Gardens, NY 11413
Saint Albans NeighborhoodEstimated Value: $690,643 - $865,000
--
Bed
--
Bath
1,743
Sq Ft
$444/Sq Ft
Est. Value
About This Home
This home is located at 12105 Milburn St, Springfield Gardens, NY 11413 and is currently estimated at $773,161, approximately $443 per square foot. 12105 Milburn St is a home located in Queens County with nearby schools including P.S. 15 Jackie Robinson, Is 59 Springfield Gardens, and Success Academy Springfield Gardens.
Ownership History
Date
Name
Owned For
Owner Type
Purchase Details
Closed on
Dec 20, 2018
Sold by
Daguizan Junior
Bought by
Brown Audrey D
Current Estimated Value
Purchase Details
Closed on
Aug 8, 2013
Sold by
Overlap Usa Llc
Bought by
Daguizan Junior
Home Financials for this Owner
Home Financials are based on the most recent Mortgage that was taken out on this home.
Original Mortgage
$301,929
Interest Rate
4.51%
Mortgage Type
New Conventional
Purchase Details
Closed on
Mar 30, 2012
Sold by
Renfroe Christopher Esq
Bought by
Overlap Usa Llc
Purchase Details
Closed on
Jan 3, 2005
Sold by
Norris Cordoza
Bought by
Brown Audrey D
Home Financials for this Owner
Home Financials are based on the most recent Mortgage that was taken out on this home.
Original Mortgage
$379,200
Interest Rate
5.81%
Mortgage Type
Purchase Money Mortgage
Create a Home Valuation Report for This Property
The Home Valuation Report is an in-depth analysis detailing your home's value as well as a comparison with similar homes in the area
Home Values in the Area
Average Home Value in this Area
Purchase History
| Date | Buyer | Sale Price | Title Company |
|---|---|---|---|
| Brown Audrey D | -- | -- | |
| Daguizan Junior | $307,500 | -- | |
| Overlap Usa Llc | $514,633 | -- | |
| Brown Audrey D | $421,350 | -- |
Source: Public Records
Mortgage History
| Date | Status | Borrower | Loan Amount |
|---|---|---|---|
| Previous Owner | Daguizan Junior | $301,929 | |
| Previous Owner | Brown Audrey D | $379,200 |
Source: Public Records
Tax History Compared to Growth
Tax History
| Year | Tax Paid | Tax Assessment Tax Assessment Total Assessment is a certain percentage of the fair market value that is determined by local assessors to be the total taxable value of land and additions on the property. | Land | Improvement |
|---|---|---|---|---|
| 2025 | $7,068 | $35,459 | $10,842 | $24,617 |
| 2024 | $7,068 | $35,191 | $12,184 | $23,007 |
| 2023 | $6,668 | $33,200 | $10,553 | $22,647 |
| 2022 | $6,253 | $38,280 | $13,980 | $24,300 |
| 2021 | $6,219 | $38,400 | $13,980 | $24,420 |
| 2020 | $6,254 | $38,640 | $13,980 | $24,660 |
| 2019 | $6,135 | $33,780 | $13,980 | $19,800 |
| 2018 | $5,640 | $27,667 | $12,421 | $15,246 |
| 2017 | $5,321 | $26,101 | $12,462 | $13,639 |
| 2016 | $4,923 | $26,101 | $12,462 | $13,639 |
| 2015 | $2,750 | $24,624 | $14,364 | $10,260 |
| 2014 | $2,750 | $24,439 | $14,129 | $10,310 |
Source: Public Records
Map
Nearby Homes
- 12133 Grayson St
- 188-51 120th Rd
- 179-50 Anderson Rd
- 17955 Anderson Rd
- 179-47 Zoller Rd
- 122-22 Nellis St
- 191-07 121st Ave
- 19009 122nd Ave
- 12244 Nellis St
- 179-01 120th Ave
- 17915 Eveleth Rd
- 18822 119th Ave
- 12253 Milburn St
- 17911 Eveleth Rd
- 191-01 122nd Ave
- 12251 Grayson St
- 17918 Selover Rd
- 12811 Harry Douglass Way
- 120-44 192nd St
- 12248 Benton St
- 121-17 Milburn St
- 18808 121st Ave
- 12111 Milburn St
- 12111 Milburn St
- 18714 121st Ave
- 18814 121st Ave
- 12117 Milburn St
- 18710 121st Ave
- 188-18 121st Ave
- 18818 121st Ave
- 18710 121st Ave
- 121-12 Milburn St
- 12112 Milburn St
- 12114 Grayson St
- 188-11 121st Ave
- 18803 121st Ave
- 18807 121st Ave
- 12121 Milburn St
- 18717 121st Ave
- 18820 121st Ave