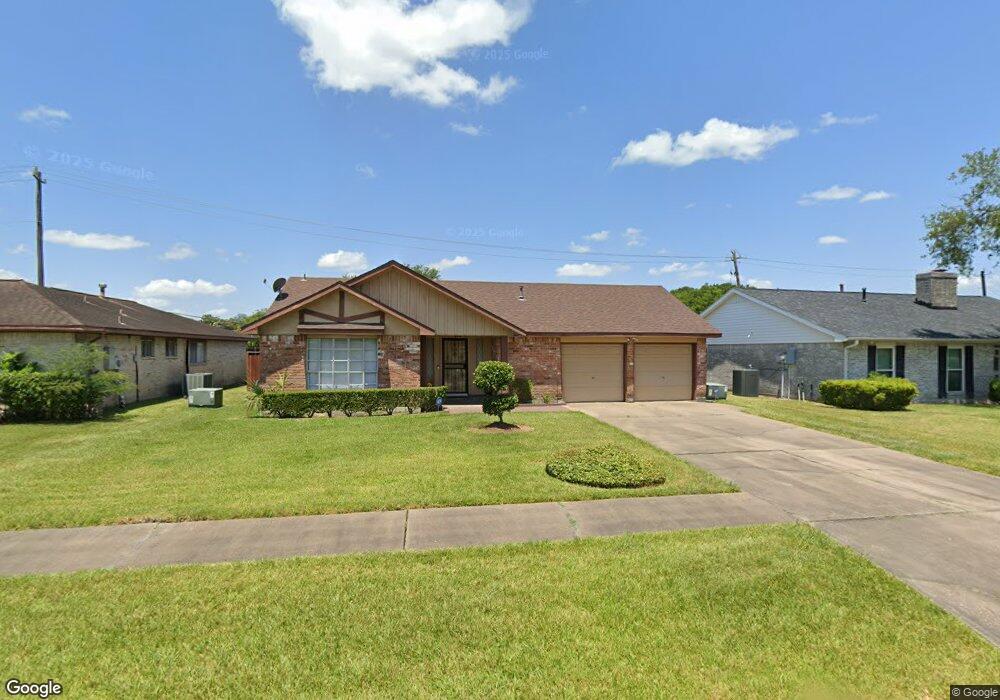
12106 Kirkholm Dr Houston, TX 77089
Southbelt-Ellington NeighborhoodEstimated Value: $248,296 - $262,000
3
Beds
2
Baths
1,839
Sq Ft
$139/Sq Ft
Est. Value
About This Home
This home is located at 12106 Kirkholm Dr, Houston, TX 77089 and is currently estimated at $255,324, approximately $138 per square foot. 12106 Kirkholm Dr is a home located in Harris County with nearby schools including Stuchbery Elementary School, Beverly Hill Intermediate School, and Morris Middle School.
Ownership History
Date
Name
Owned For
Owner Type
Purchase Details
Closed on
Aug 25, 1999
Sold by
Flores Jim Jan and Flores Candy Roblez
Bought by
Freeman Priscilla P
Current Estimated Value
Home Financials for this Owner
Home Financials are based on the most recent Mortgage that was taken out on this home.
Original Mortgage
$73,200
Outstanding Balance
$20,920
Interest Rate
7.58%
Estimated Equity
$234,404
Purchase Details
Closed on
Aug 21, 1996
Sold by
Viscusi Nellye C
Bought by
Flores Jim Jan and Flores Candy Roblez
Home Financials for this Owner
Home Financials are based on the most recent Mortgage that was taken out on this home.
Original Mortgage
$62,100
Interest Rate
8.42%
Purchase Details
Closed on
Dec 15, 1994
Sold by
Viscusi Louis and Viscusi Nellye
Bought by
Viscusi Family Management Trust
Create a Home Valuation Report for This Property
The Home Valuation Report is an in-depth analysis detailing your home's value as well as a comparison with similar homes in the area
Home Values in the Area
Average Home Value in this Area
Purchase History
| Date | Buyer | Sale Price | Title Company |
|---|---|---|---|
| Freeman Priscilla P | -- | First American Title | |
| Flores Jim Jan | -- | -- | |
| Viscusi Family Management Trust | -- | -- |
Source: Public Records
Mortgage History
| Date | Status | Borrower | Loan Amount |
|---|---|---|---|
| Open | Freeman Priscilla P | $73,200 | |
| Previous Owner | Flores Jim Jan | $62,100 | |
| Closed | Freeman Priscilla P | $9,150 |
Source: Public Records
Tax History Compared to Growth
Tax History
| Year | Tax Paid | Tax Assessment Tax Assessment Total Assessment is a certain percentage of the fair market value that is determined by local assessors to be the total taxable value of land and additions on the property. | Land | Improvement |
|---|---|---|---|---|
| 2025 | $902 | $241,897 | $41,101 | $200,796 |
| 2024 | $902 | $239,474 | $41,101 | $198,373 |
| 2023 | $902 | $239,474 | $41,101 | $198,373 |
| 2022 | $5,139 | $225,841 | $41,101 | $184,740 |
| 2021 | $4,902 | $182,495 | $41,101 | $141,394 |
| 2020 | $5,019 | $183,105 | $41,101 | $142,004 |
| 2019 | $4,867 | $177,942 | $34,251 | $143,691 |
| 2018 | $1,768 | $153,465 | $26,373 | $127,092 |
| 2017 | $3,900 | $153,465 | $26,373 | $127,092 |
| 2016 | $3,545 | $142,724 | $26,373 | $116,351 |
| 2015 | $2,357 | $123,973 | $23,976 | $99,997 |
| 2014 | $2,357 | $115,375 | $20,551 | $94,824 |
Source: Public Records
Map
Nearby Homes
- 11930 Kirkway Dr
- 12023 Sagecliff Dr
- 10519 Kirkglen Dr
- 10507 Kirkhill Dr
- 11111 Sagecrest Ln
- 11107 Kirkpark Dr
- 11611 Sagedowne Ln
- 11314 Sageland Dr
- 11123 Sageview Dr
- 11810 Sagedowne Ln
- 11433 Sabo Rd
- 11106 Sagehill Dr
- 11326 Sagecreek Dr
- 11427 Sageglen Dr
- 11435 Meadoway Dr
- 10914 Sagepark Ln
- 11414 Kirkwyn Dr
- 10810 Kirkbend Dr
- 10519 Sagepark Ln
- 11514 Quincewood Dr
- 12110 Kirkholm Dr
- 12102 Kirkholm Dr
- 12114 Kirkholm Dr
- 12103 Kirkbriar Dr
- 12107 Kirkbriar Dr
- 12111 Kirkbriar Dr
- 12022 Kirkholm Dr
- 12107 Kirkholm Dr
- 12111 Kirkholm Dr
- 12118 Kirkholm Dr
- 12103 Kirkholm Dr
- 12115 Kirkholm Dr
- 12015 Kirkbriar Dr
- 12018 Kirkholm Dr
- 12119 Kirkholm Dr
- 10403 Sageforest Dr
- 12122 Kirkholm Dr
- 10406 Sageforest Dr
- 12119 Kirkbriar Dr
- 12018 Kirknoll Dr