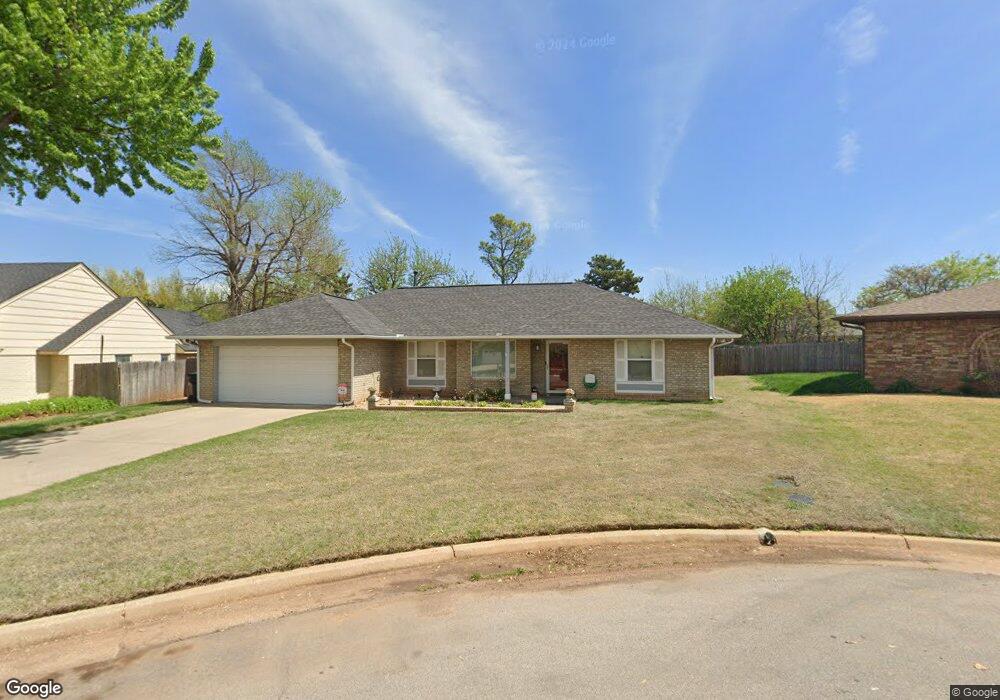
12108 N Greystone Cir Oklahoma City, OK 73120
Camelot Estates NeighborhoodEstimated Value: $231,015 - $268,000
3
Beds
2
Baths
1,806
Sq Ft
$136/Sq Ft
Est. Value
About This Home
This home is located at 12108 N Greystone Cir, Oklahoma City, OK 73120 and is currently estimated at $245,754, approximately $136 per square foot. 12108 N Greystone Cir is a home located in Oklahoma County with nearby schools including Quail Creek Elementary School, John Marshall Enterprise Middle School, and John Marshall Enterprise High School.
Ownership History
Date
Name
Owned For
Owner Type
Purchase Details
Closed on
Sep 3, 2021
Sold by
Hamilton Ladonna F and Mustapher Ollie
Bought by
Mustapher Ladonna F and Mustapher Ollie
Current Estimated Value
Purchase Details
Closed on
Apr 19, 2010
Sold by
Trout Keya R and Trout Keith A
Bought by
Hamilton Ladonna F and Mustapher Ollie
Home Financials for this Owner
Home Financials are based on the most recent Mortgage that was taken out on this home.
Original Mortgage
$131,965
Outstanding Balance
$90,675
Interest Rate
5.65%
Mortgage Type
FHA
Estimated Equity
$155,079
Purchase Details
Closed on
Jun 27, 2003
Sold by
Vasseur Mary Kaye
Bought by
Trout Keya R and Trout Keith A
Purchase Details
Closed on
Apr 23, 2003
Sold by
Whisler Mildred A
Bought by
Vasseur Mary Kaye
Create a Home Valuation Report for This Property
The Home Valuation Report is an in-depth analysis detailing your home's value as well as a comparison with similar homes in the area
Home Values in the Area
Average Home Value in this Area
Purchase History
| Date | Buyer | Sale Price | Title Company |
|---|---|---|---|
| Mustapher Ladonna F | -- | None Available | |
| Hamilton Ladonna F | $134,500 | Old Republic Title Company O | |
| Trout Keya R | $100,500 | Lawyers Title Of Ok City Inc | |
| Vasseur Mary Kaye | -- | First Amer Title & Trust Co |
Source: Public Records
Mortgage History
| Date | Status | Borrower | Loan Amount |
|---|---|---|---|
| Open | Hamilton Ladonna F | $131,965 |
Source: Public Records
Tax History Compared to Growth
Tax History
| Year | Tax Paid | Tax Assessment Tax Assessment Total Assessment is a certain percentage of the fair market value that is determined by local assessors to be the total taxable value of land and additions on the property. | Land | Improvement |
|---|---|---|---|---|
| 2024 | $2,221 | $18,986 | $2,743 | $16,243 |
| 2023 | $2,221 | $18,082 | $2,722 | $15,360 |
| 2022 | $2,026 | $17,221 | $2,830 | $14,391 |
| 2021 | $1,930 | $16,401 | $4,633 | $11,768 |
| 2020 | $1,860 | $15,620 | $4,691 | $10,929 |
| 2019 | $1,828 | $15,361 | $4,614 | $10,747 |
| 2018 | $1,660 | $14,630 | $0 | $0 |
| 2017 | $1,677 | $14,794 | $3,515 | $11,279 |
| 2016 | $1,672 | $14,739 | $3,515 | $11,224 |
| 2015 | $1,781 | $15,556 | $3,515 | $12,041 |
| 2014 | $1,718 | $15,090 | $3,515 | $11,575 |
Source: Public Records
Map
Nearby Homes
- 2400 NW 121st St
- 2341 NW 120th Cir
- 2501 NW 121st St
- 2317 NW 119th St
- 12300 Springwood Dr
- 2316 NW 118th St
- 2524 NW 116th St
- 2533 Indian Creek Place
- 12215 N Pennsylvania Ave
- 11604 N Victoria Dr
- 12104 Camelot Place
- 2116 NW 118th Terrace
- 2525 Lee Ln
- 2728 Camelot Dr
- 2101 NW 118th Terrace
- 2821 NW 117th St
- 2501 Patti Place
- 2707 Silvertree Dr
- 2325 NW 112th Terrace
- 2522 NW 129th St
- 11308 N Greystone Cir
- 12112 N Greystone Cir
- 12104 N Greystone Cir
- 2349 NW 120th Cir
- 12100 N Greystone Cir
- 2345 NW 120th Cir
- 2405 NW 120th St
- 12109 N Greystone Cir
- 2409 NW 120th St
- 12113 N Greystone Cir
- 2401 NW 120th St
- 12105 N Greystone Cir
- 2417 NW 120th St
- 2364 NW 121st St
- 2425 NW 120th St
- 12213 N Greystone Cir
- 2429 NW 120th St
- 2417 NW 121st St
- 2360 NW 121st St
- 12200 Greystone Ave