Estimated Value: $232,000 - $409,563
3
Beds
1
Bath
1,790
Sq Ft
$175/Sq Ft
Est. Value
About This Home
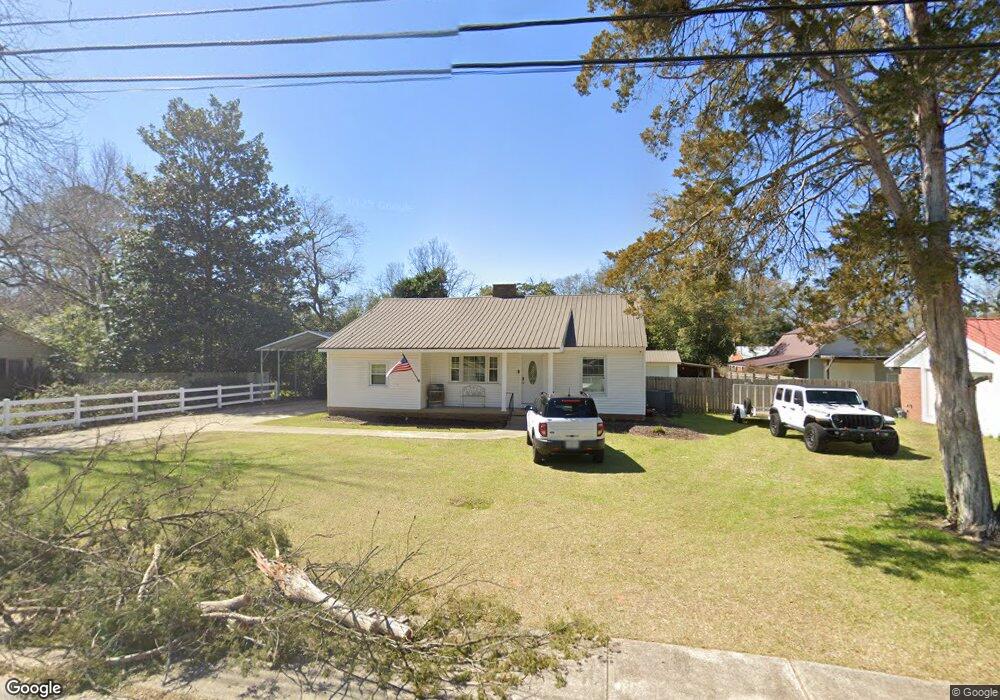
This home is located at 1211 3rd St, Perry, GA 31069 and is currently estimated at $313,391, approximately $175 per square foot. 1211 3rd St is a home located in Houston County with nearby schools including Morningside Elementary School, Perry Middle School, and Perry High School.
Ownership History
Date
Name
Owned For
Owner Type
Purchase Details
Closed on
Aug 21, 2013
Sold by
Emmons Brian J
Bought by
Emmons Brian J and Seefluth Brenda
Current Estimated Value
Purchase Details
Closed on
Oct 19, 2012
Sold by
Seefluth Brenda
Bought by
Emmons Brian J
Purchase Details
Closed on
Apr 30, 2012
Sold by
Synovus Bank
Bought by
Seefluth Brenda
Purchase Details
Closed on
Sep 21, 2011
Sold by
Whitten Frances C
Bought by
Synovus Bank and Columbus Bank & Trust Company
Purchase Details
Closed on
Dec 17, 2007
Sold by
Whitten Frances C
Bought by
Whitten Lance
Purchase Details
Closed on
Sep 15, 2003
Sold by
Whitten Emmett B Estate
Bought by
Whitten Frances C
Purchase Details
Closed on
Apr 18, 1984
Sold by
Whitten Emmett B
Bought by
Whitten Emmett B and Whitten Frances C
Purchase Details
Closed on
Sep 3, 1965
Sold by
Sanders Tom W and Sanders Mary H
Bought by
Whitten Emmett B
Purchase Details
Closed on
Dec 30, 1963
Sold by
Moody Robert O
Bought by
Sanders Tom W and Sanders Mary H
Purchase Details
Closed on
Nov 10, 1950
Bought by
Moody Robert O
Create a Home Valuation Report for This Property
The Home Valuation Report is an in-depth analysis detailing your home's value as well as a comparison with similar homes in the area
Home Values in the Area
Average Home Value in this Area
Purchase History
| Date | Buyer | Sale Price | Title Company |
|---|---|---|---|
| Emmons Brian J | -- | -- | |
| Emmons Brian J | -- | None Available | |
| Seefluth Brenda | $30,000 | None Available | |
| Synovus Bank | $58,598 | None Available | |
| Whitten Lance | -- | None Available | |
| Whitten Frances C | -- | -- | |
| Whitten Emmett B | -- | -- | |
| Whitten Emmett B | -- | -- | |
| Sanders Tom W | -- | -- | |
| Moody Robert O | -- | -- |
Source: Public Records
Tax History Compared to Growth
Tax History
| Year | Tax Paid | Tax Assessment Tax Assessment Total Assessment is a certain percentage of the fair market value that is determined by local assessors to be the total taxable value of land and additions on the property. | Land | Improvement |
|---|---|---|---|---|
| 2024 | $1,846 | $50,240 | $5,120 | $45,120 |
| 2023 | $1,551 | $41,920 | $5,120 | $36,800 |
| 2022 | $872 | $37,920 | $5,120 | $32,800 |
| 2021 | $792 | $34,240 | $5,120 | $29,120 |
| 2020 | $783 | $33,720 | $5,120 | $28,600 |
| 2019 | $783 | $33,720 | $5,120 | $28,600 |
| 2018 | $783 | $33,720 | $5,120 | $28,600 |
| 2017 | $784 | $33,720 | $5,120 | $28,600 |
| 2016 | $785 | $33,720 | $5,120 | $28,600 |
| 2015 | $787 | $33,720 | $5,120 | $28,600 |
| 2014 | -- | $33,720 | $5,120 | $28,600 |
| 2013 | -- | $43,800 | $5,120 | $38,680 |
Source: Public Records
Map
Nearby Homes
- 1207 Swift St
- 1212 Swift St
- 0 Carroll Aly
- 113 Pridgen Pass
- 104 Pridgen Pass
- 126 Bramblewood Ln
- 1402 Park Ave
- 113 Flat Rock Ln
- 100 Flat Rock Ln
- The Pearson Plan at Avalon
- The Crawford Plan at Avalon
- The Piedmont Plan at Avalon
- The McGinnis Plan at Avalon
- The Coleman Plan at Avalon
- The Lawson Plan at Avalon
- The Bradley Plan at Avalon
- The Harrington Plan at Avalon
- 905 Massee Ln
- 903 Massee Ln
- 1312 Sam Nunn Blvd
- 1209 3rd St
- 312 Wax Myrtle Way Unit 6E
- 1213 3rd St
- 1301 Georgia Ave
- 1217 Georgia Avenue Extension Unit EXT
- 1208 Crescent Dr
- 1300 Georgia Ave
- 1216 Crescent Dr
- 1220 Smoak Ave
- 1303 Georgia Ave
- 1215 Ga Ave Extension
- 1218 Smoak Ave
- 1300 Smoak Ave
- 1215 Georgia Avenue Extension Unit EXT
- 1302 Georgia Ave
- 1305 Georgia Ave
- 1205 3rd St
- 509 Georgia Avenue Extension
- 1302 Smoak Ave
- 1301 Parkway Dr