1211 9th St Tell City, IN 47586
Estimated Value: $107,000 - $149,000
4
Beds
2
Baths
1,765
Sq Ft
$74/Sq Ft
Est. Value
About This Home
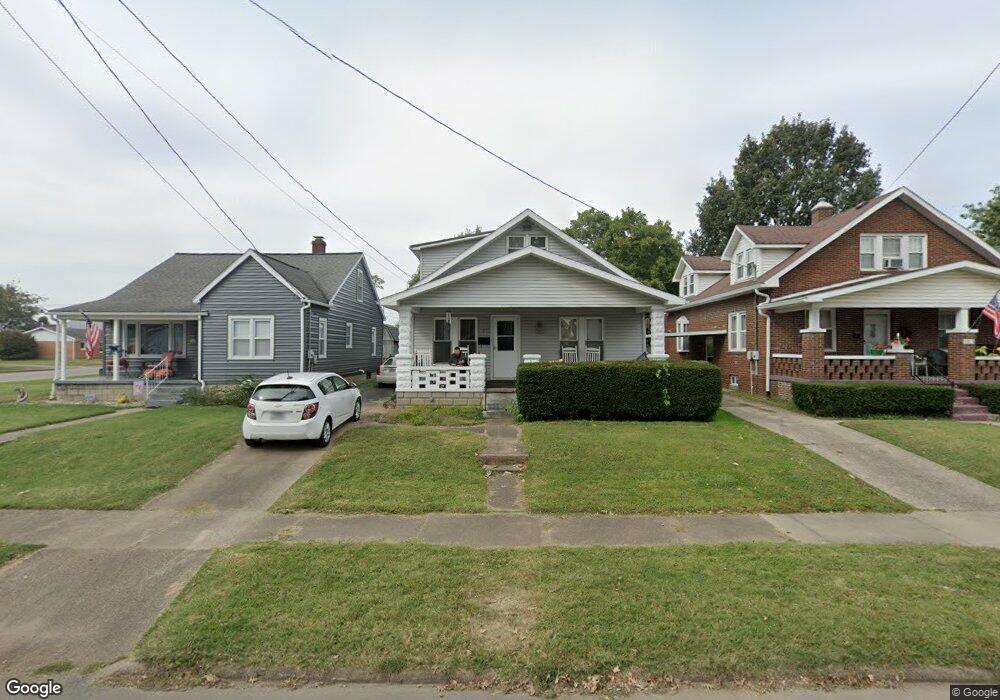
This home is located at 1211 9th St, Tell City, IN 47586 and is currently estimated at $131,086, approximately $74 per square foot. 1211 9th St is a home located in Perry County with nearby schools including William Tell Elementary School, Tell City Junior/Senior High School, and Agape Christian Academy.
Ownership History
Date
Name
Owned For
Owner Type
Purchase Details
Closed on
Oct 10, 2013
Sold by
Nash Crystal H
Bought by
Nash Christopher E
Current Estimated Value
Purchase Details
Closed on
May 18, 2006
Sold by
Hess Mark E and Hess Debbie K
Bought by
Nash Christopher E and Nash Crystal H
Home Financials for this Owner
Home Financials are based on the most recent Mortgage that was taken out on this home.
Original Mortgage
$79,000
Interest Rate
11.41%
Mortgage Type
Adjustable Rate Mortgage/ARM
Create a Home Valuation Report for This Property
The Home Valuation Report is an in-depth analysis detailing your home's value as well as a comparison with similar homes in the area
Home Values in the Area
Average Home Value in this Area
Purchase History
| Date | Buyer | Sale Price | Title Company |
|---|---|---|---|
| Nash Christopher E | $52,000 | -- | |
| Nash Christopher E | -- | None Available |
Source: Public Records
Mortgage History
| Date | Status | Borrower | Loan Amount |
|---|---|---|---|
| Previous Owner | Nash Christopher E | $79,000 |
Source: Public Records
Tax History Compared to Growth
Tax History
| Year | Tax Paid | Tax Assessment Tax Assessment Total Assessment is a certain percentage of the fair market value that is determined by local assessors to be the total taxable value of land and additions on the property. | Land | Improvement |
|---|---|---|---|---|
| 2024 | $1,900 | $95,000 | $6,200 | $88,800 |
| 2023 | $1,696 | $84,800 | $6,200 | $78,600 |
| 2022 | $1,467 | $72,900 | $6,200 | $66,700 |
| 2021 | $1,637 | $81,100 | $5,200 | $75,900 |
| 2020 | $1,533 | $75,900 | $5,200 | $70,700 |
| 2019 | $1,582 | $78,200 | $5,000 | $73,200 |
| 2018 | $1,577 | $77,800 | $5,000 | $72,800 |
| 2017 | $1,536 | $75,600 | $5,000 | $70,600 |
| 2016 | $1,529 | $75,100 | $5,000 | $70,100 |
| 2014 | $732 | $80,300 | $5,200 | $75,100 |
| 2013 | $732 | $76,500 | $5,200 | $71,300 |
Source: Public Records
Map
Nearby Homes