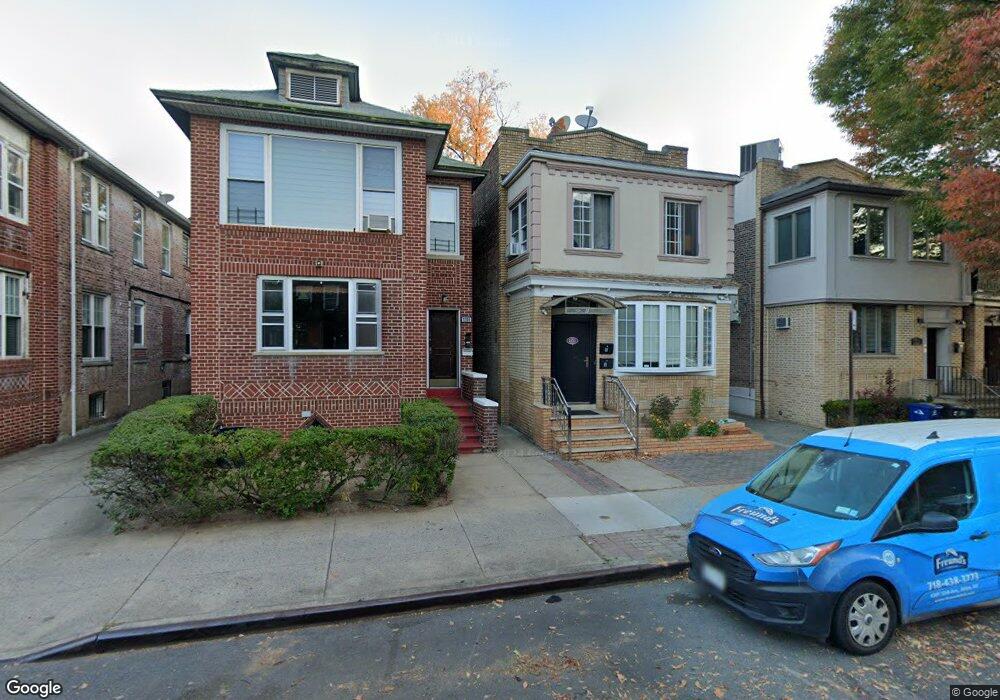
1211 Avenue I Brooklyn, NY 11230
Midwood NeighborhoodEstimated Value: $1,248,080 - $1,872,000
--
Bed
--
Bath
3,200
Sq Ft
$498/Sq Ft
Est. Value
About This Home
This home is located at 1211 Avenue I, Brooklyn, NY 11230 and is currently estimated at $1,592,270, approximately $497 per square foot. 1211 Avenue I is a home located in Kings County with nearby schools including P.S. 99 Isaac Asimov, Yeshiva Rabbi Chaim Berlin, and Yeshivah of Flatbush Elementary School.
Ownership History
Date
Name
Owned For
Owner Type
Purchase Details
Closed on
May 16, 2011
Sold by
Amr Mohammad S and Farooq Mohammad
Bought by
Amr Mohammad S and Rehman Shafiq U
Current Estimated Value
Purchase Details
Closed on
Jun 22, 2007
Sold by
Kenneth M Mazlen As Trustee and Roger G Mazlen As Trustee
Bought by
Amr Mohammad S and Farooq Mohammad
Home Financials for this Owner
Home Financials are based on the most recent Mortgage that was taken out on this home.
Original Mortgage
$533,000
Interest Rate
6.39%
Mortgage Type
Purchase Money Mortgage
Purchase Details
Closed on
May 29, 2001
Sold by
Mazlen Anna
Bought by
Mazlen Kenneth M and Mzalen Roger G Trustee
Purchase Details
Closed on
Feb 1, 1998
Sold by
Mazlen Anna
Bought by
Mazlen Anna
Create a Home Valuation Report for This Property
The Home Valuation Report is an in-depth analysis detailing your home's value as well as a comparison with similar homes in the area
Home Values in the Area
Average Home Value in this Area
Purchase History
| Date | Buyer | Sale Price | Title Company |
|---|---|---|---|
| Amr Mohammad S | -- | -- | |
| Amr Mohammad S | -- | -- | |
| Amr Mohammad S | $685,000 | -- | |
| Amr Mohammad S | $685,000 | -- | |
| Mazlen Kenneth M | -- | -- | |
| Mazlen Kenneth M | -- | -- | |
| Mazlen Anna | -- | Titleserv | |
| Mazlen Anna | -- | Titleserv |
Source: Public Records
Mortgage History
| Date | Status | Borrower | Loan Amount |
|---|---|---|---|
| Previous Owner | Amr Mohammad S | $533,000 |
Source: Public Records
Tax History Compared to Growth
Tax History
| Year | Tax Paid | Tax Assessment Tax Assessment Total Assessment is a certain percentage of the fair market value that is determined by local assessors to be the total taxable value of land and additions on the property. | Land | Improvement |
|---|---|---|---|---|
| 2025 | $10,755 | $100,680 | $24,480 | $76,200 |
| 2024 | $10,755 | $118,440 | $24,480 | $93,960 |
| 2023 | $10,875 | $124,500 | $24,480 | $100,020 |
| 2022 | $10,492 | $136,380 | $24,480 | $111,900 |
| 2021 | $10,435 | $105,300 | $24,480 | $80,820 |
| 2020 | $4,894 | $114,120 | $24,480 | $89,640 |
| 2019 | $9,334 | $90,720 | $24,480 | $66,240 |
| 2018 | $8,799 | $44,622 | $15,722 | $28,900 |
| 2017 | $8,629 | $43,798 | $15,431 | $28,367 |
| 2016 | $7,950 | $41,320 | $17,821 | $23,499 |
| 2015 | $4,764 | $38,983 | $19,258 | $19,725 |
| 2014 | $4,764 | $37,185 | $17,188 | $19,997 |
Source: Public Records
Map
Nearby Homes
- 1202 Avenue I
- 941 E 15th St
- 1312 Avenue H
- 945 E 15th St
- 1620 Avenue I Unit 307
- 1620 Avenue I Unit 216
- 1620 Avenue I Unit 507
- 1620 Avenue I Unit 502
- 1615 Avenue I Unit 511
- 1615 Avenue I Unit 122
- 1615 Avenue I Unit 102
- 793 Westminster Rd
- 920 E 17th St Unit 122
- 920 E 17th St Unit 411
- 945 E 10th St
- 769 Argyle Rd
- 770 Argyle Rd
- 1602 Avenue H
- 28 Wellington Ct
- 915 E 17th St Unit 116