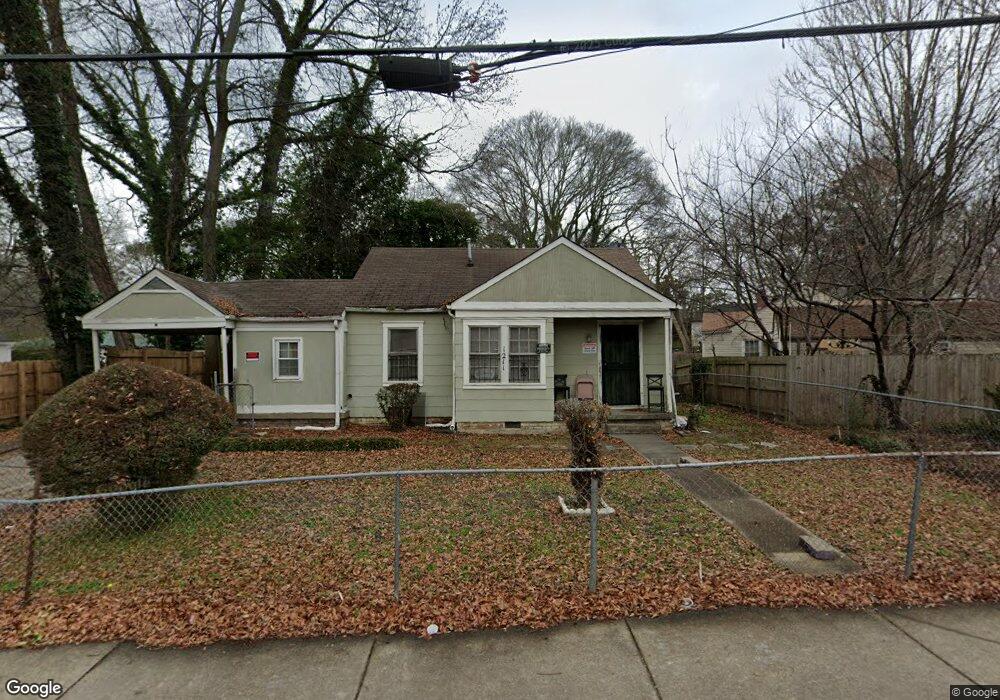
1211 Campbellton Rd SW Unit E Atlanta, GA 30310
Oakland City NeighborhoodEstimated Value: $133,000 - $161,000
2
Beds
1
Bath
699
Sq Ft
$217/Sq Ft
Est. Value
About This Home
This home is located at 1211 Campbellton Rd SW Unit E, Atlanta, GA 30310 and is currently estimated at $151,902, approximately $217 per square foot. 1211 Campbellton Rd SW Unit E is a home located in Fulton County with nearby schools including Finch Elementary School, Sylvan Hills Middle School, and Carver High School.
Ownership History
Date
Name
Owned For
Owner Type
Purchase Details
Closed on
Aug 23, 2019
Sold by
3N Superior Realty Llc
Bought by
Tran Kim and Nguyen Tho
Current Estimated Value
Purchase Details
Closed on
Jun 21, 2019
Sold by
Nguyen Tho
Bought by
3N Superior Realty Llc
Purchase Details
Closed on
May 22, 2019
Sold by
Emp Homes Llc
Bought by
Nguyen Tho and Nguyen Tam
Purchase Details
Closed on
Mar 28, 2019
Sold by
Robinson Bruce
Bought by
Emp Homes Llc
Purchase Details
Closed on
Jun 22, 2000
Sold by
Hud
Bought by
Dodd Hazel L
Home Financials for this Owner
Home Financials are based on the most recent Mortgage that was taken out on this home.
Original Mortgage
$55,296
Interest Rate
8.11%
Mortgage Type
New Conventional
Purchase Details
Closed on
Oct 6, 1998
Sold by
Chase Manhattan Mtg Corp
Bought by
Sec Of Hud
Purchase Details
Closed on
Sep 30, 1998
Sold by
Small Renee
Bought by
Small Audrey
Create a Home Valuation Report for This Property
The Home Valuation Report is an in-depth analysis detailing your home's value as well as a comparison with similar homes in the area
Home Values in the Area
Average Home Value in this Area
Purchase History
| Date | Buyer | Sale Price | Title Company |
|---|---|---|---|
| Tran Kim | $85,000 | -- | |
| 3N Superior Realty Llc | -- | -- | |
| Nguyen Tho | $72,000 | -- | |
| Emp Homes Llc | $46,000 | -- | |
| Dodd Hazel L | -- | -- | |
| Sec Of Hud | -- | -- | |
| Chase Manhattan Mtg Corp | $45,064 | -- | |
| Small Audrey | -- | -- |
Source: Public Records
Mortgage History
| Date | Status | Borrower | Loan Amount |
|---|---|---|---|
| Previous Owner | Dodd Hazel L | $55,296 |
Source: Public Records
Tax History Compared to Growth
Tax History
| Year | Tax Paid | Tax Assessment Tax Assessment Total Assessment is a certain percentage of the fair market value that is determined by local assessors to be the total taxable value of land and additions on the property. | Land | Improvement |
|---|---|---|---|---|
| 2025 | $2,135 | $66,920 | $30,280 | $36,640 |
| 2023 | $2,542 | $61,400 | $23,240 | $38,160 |
| 2022 | $2,485 | $61,400 | $23,240 | $38,160 |
| 2021 | $1,447 | $35,720 | $10,880 | $24,840 |
| 2020 | $1,381 | $33,720 | $14,160 | $19,560 |
| 2019 | $488 | $32,120 | $14,440 | $17,680 |
| 2018 | $505 | $12,200 | $6,160 | $6,040 |
| 2017 | $385 | $8,920 | $2,920 | $6,000 |
| 2016 | $386 | $8,920 | $2,920 | $6,000 |
| 2015 | $870 | $8,920 | $2,920 | $6,000 |
| 2014 | $321 | $7,080 | $3,040 | $4,040 |
Source: Public Records
Map
Nearby Homes
- 1226 Byewood Ln SW
- 1285 Campbellton Rd SW
- 1282 Campbellton Rd SW
- 1404 Byrere Terrace SW
- 1240 Oakland Terrace SW Unit B
- 1485 Ryan St SW
- 1339 Campbellton Rd SW
- 1347 Campbellton Rd SW
- 1225 Oakland Dr SW
- 1223 Oakland Dr SW
- 1355 Campbellton Rd SW
- 1391 Lorenzo Dr SW
- 1070 Dill Ave SW
- 1249 Epworth St SW
- 1356 Campbellton Rd SW
- 1234 Princess Ave SW
- 1227 Epworth St SW
- 1310 Kenilworth Dr SW
- 1285 Avon Ave SW
- 1365 Oakland Dr SW
- 1221 Campbellton Place SW
- 1357 Oakland Dr SW
- 1225 Campbellton Place SW
- 1353 Oakland Dr SW
- 1231 Campbellton Place SW
- 1223 Campbellton Place SW
- 1223 Campbellton Place SW Unit 1223
- 0 Campbellton Place SW Unit 5361754-7989379
- 0 Campbellton Place SW Unit 5361754-9012146
- 0 Campbellton Place SW Unit 8864284
- 0 Campbellton Place SW Unit 8545330
- 0 Campbellton Place SW Unit 8483444
- 0 Campbellton Place SW Unit 7284295
- 0 Campbellton Place SW Unit 3189179
- 0 Campbellton Place SW Unit 8119249
- 0 Campbellton Place SW Unit 8655144
- 0 Campbellton Place SW Unit 8505729
- 0 Campbellton Place SW Unit 8491639
- 0 Campbellton Place SW