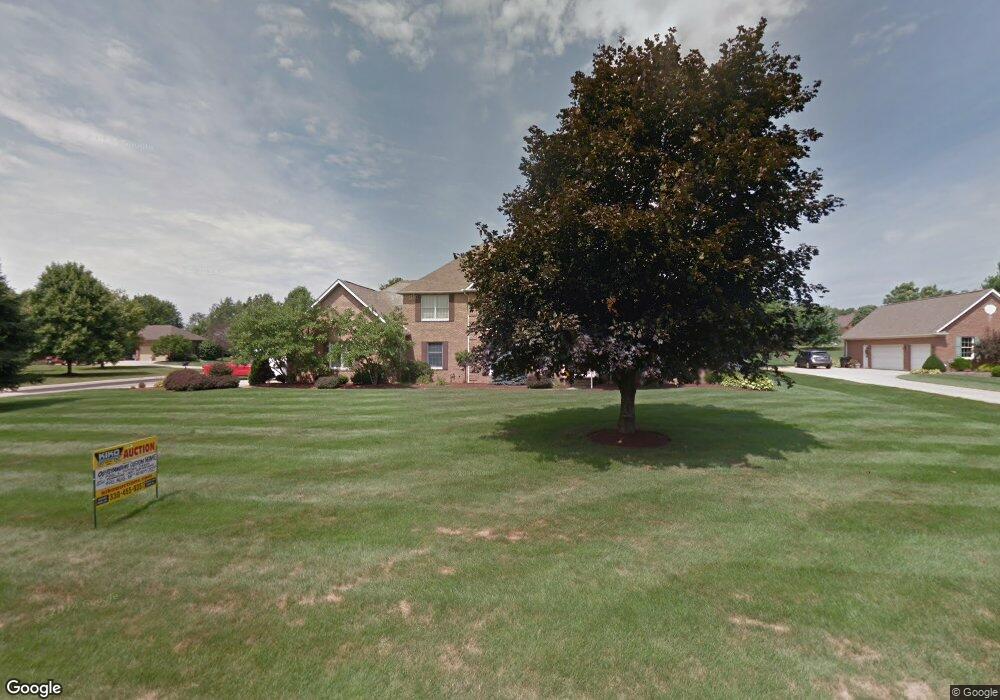
1211 Cobblefield St NE Canton, OH 44721
Estimated Value: $626,467 - $671,000
4
Beds
6
Baths
4,612
Sq Ft
$139/Sq Ft
Est. Value
About This Home
This home is located at 1211 Cobblefield St NE, Canton, OH 44721 and is currently estimated at $641,489, approximately $139 per square foot. 1211 Cobblefield St NE is a home located in Stark County with nearby schools including Charles L. Warstler Elementary School, Oakwood Middle School, and GlenOak High School.
Ownership History
Date
Name
Owned For
Owner Type
Purchase Details
Closed on
Apr 21, 2020
Sold by
White Chrsitine E and White John
Bought by
Ccw Real Estate Llc
Current Estimated Value
Purchase Details
Closed on
Sep 20, 2011
Sold by
Bitzel Lorie A and Bitzel Pete A
Bought by
White John C and White Christine E
Home Financials for this Owner
Home Financials are based on the most recent Mortgage that was taken out on this home.
Original Mortgage
$339,900
Interest Rate
4.32%
Mortgage Type
New Conventional
Purchase Details
Closed on
Dec 21, 1992
Purchase Details
Closed on
Feb 21, 1992
Purchase Details
Closed on
Oct 18, 1990
Create a Home Valuation Report for This Property
The Home Valuation Report is an in-depth analysis detailing your home's value as well as a comparison with similar homes in the area
Home Values in the Area
Average Home Value in this Area
Purchase History
| Date | Buyer | Sale Price | Title Company |
|---|---|---|---|
| Ccw Real Estate Llc | $140,000 | None Available | |
| White John C | $453,200 | Attorney | |
| -- | $340,000 | -- | |
| -- | $55,500 | -- | |
| -- | $51,000 | -- |
Source: Public Records
Mortgage History
| Date | Status | Borrower | Loan Amount |
|---|---|---|---|
| Previous Owner | White John C | $339,900 |
Source: Public Records
Tax History Compared to Growth
Tax History
| Year | Tax Paid | Tax Assessment Tax Assessment Total Assessment is a certain percentage of the fair market value that is determined by local assessors to be the total taxable value of land and additions on the property. | Land | Improvement |
|---|---|---|---|---|
| 2025 | -- | $210,280 | $43,330 | $166,950 |
| 2024 | -- | $210,280 | $43,330 | $166,950 |
| 2023 | $9,560 | $197,650 | $39,100 | $158,550 |
| 2022 | $5,678 | $197,650 | $39,100 | $158,550 |
| 2021 | $9,489 | $197,650 | $39,100 | $158,550 |
| 2020 | $8,628 | $166,960 | $33,710 | $133,250 |
| 2019 | $8,556 | $166,960 | $33,710 | $133,250 |
| 2018 | $8,452 | $166,960 | $33,710 | $133,250 |
| 2017 | $8,593 | $155,860 | $31,220 | $124,640 |
| 2016 | $8,615 | $155,860 | $31,220 | $124,640 |
| 2015 | $8,328 | $155,860 | $31,220 | $124,640 |
| 2014 | $149 | $149,180 | $29,890 | $119,290 |
| 2013 | $3,989 | $149,180 | $29,890 | $119,290 |
Source: Public Records
Map
Nearby Homes
- 5845 Royal Hill Cir NE
- 5901 Market Ave N
- 5634 Brentwood Ave NW
- 5225 Loma Linda Ln NE
- 6816 Harrington Court Ave NE
- 2040 55th St NE
- 6010 Firestone Rd NE
- 308 52nd St NW
- 1904 Red Coach Rd NW
- 1614 Bellview St NE
- 1711 Glenmar Oval SE
- 1563 Bellview St NE
- 5409 Glenhill Ave NE
- 1627 Seabiscuit Dr NE
- 6464 Harness Cir NE
- 6110 Glessner Ave NE
- 2511 58th St NE
- 2317 Raintree St NE
- 1573 Lancaster Gate SE
- 5147 Susetta Ave NW
- 1225 Cobblefield St NE
- 5607 Loma Linda Ln NE
- 5621 Loma Linda Ln NE
- 1241 Cobblefield St NE
- 1210 Cobblefield St NE
- 1310 Chantilly Cir NE
- 5715 Loma Linda Ln NE
- 1224 Cobblefield St NE
- 5591 Loma Linda Ln NE
- 1324 Chantilly Cir NE
- 5729 Loma Linda Ln NE
- 1238 Cobblefield St NE
- 1255 Cobblefield St NE
- 5577 Loma Linda Ln NE
- 1408 Chantilly Cir NE
- 0 Cobblefield St NE
- 1117 Cobblefield St NE
- 5801 Loma Linda Ln NE
- 1252 Cobblefield St NE
- 5716 Kings Gate Cir NE