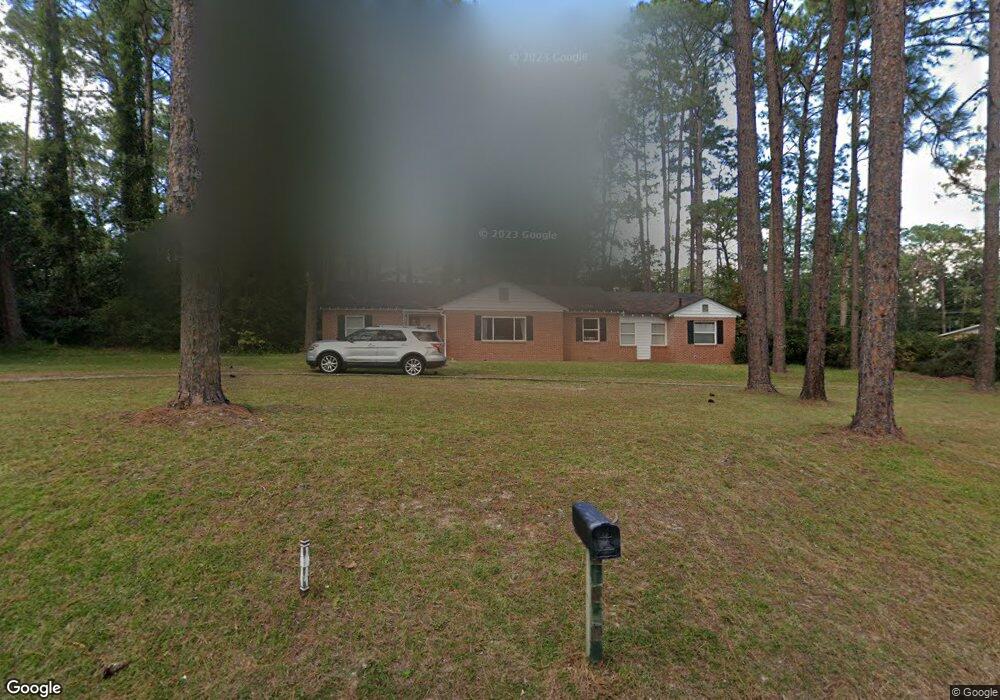
1211 Coral Rd Waycross, GA 31501
Estimated Value: $181,000 - $216,000
3
Beds
2
Baths
1,908
Sq Ft
$108/Sq Ft
Est. Value
About This Home
This home is located at 1211 Coral Rd, Waycross, GA 31501 and is currently estimated at $206,573, approximately $108 per square foot. 1211 Coral Rd is a home located in Ware County with nearby schools including Center Elementary School, Waycross Middle School, and Ware County High School.
Ownership History
Date
Name
Owned For
Owner Type
Purchase Details
Closed on
Jul 10, 2020
Sold by
Brencat Properties Llc
Bought by
Najera Christian and Banuelos Erika D
Current Estimated Value
Home Financials for this Owner
Home Financials are based on the most recent Mortgage that was taken out on this home.
Original Mortgage
$56,000
Interest Rate
3.2%
Mortgage Type
New Conventional
Purchase Details
Closed on
Sep 5, 2014
Sold by
Jeffords Walter C
Bought by
Tanner Jerry L and Tanner Sharon L
Home Financials for this Owner
Home Financials are based on the most recent Mortgage that was taken out on this home.
Original Mortgage
$10,000,000
Interest Rate
4.2%
Mortgage Type
New Conventional
Purchase Details
Closed on
Apr 17, 2009
Sold by
Persson Edward A and Persson Fannie V
Bought by
Jeffords Walter C and Jeffords Tamara
Purchase Details
Closed on
Oct 2, 2006
Sold by
Persson Edward A
Bought by
Persson Edward A and Persson Fannie
Purchase Details
Closed on
Sep 29, 2006
Sold by
Leshher James E
Bought by
Persson Edward A and Persson Fanny
Create a Home Valuation Report for This Property
The Home Valuation Report is an in-depth analysis detailing your home's value as well as a comparison with similar homes in the area
Home Values in the Area
Average Home Value in this Area
Purchase History
| Date | Buyer | Sale Price | Title Company |
|---|---|---|---|
| Najera Christian | $85,000 | -- | |
| Brencat Properties Llc | $70,000 | -- | |
| Tanner Jerry L | $35,000 | -- | |
| Jeffords Walter C | $97,900 | -- | |
| Persson Edward A | -- | -- | |
| Persson Edward A | $97,000 | -- |
Source: Public Records
Mortgage History
| Date | Status | Borrower | Loan Amount |
|---|---|---|---|
| Closed | Brencat Properties Llc | $56,000 | |
| Closed | Najera Christian | $78,000 | |
| Previous Owner | Tanner Jerry L | $10,000,000 |
Source: Public Records
Tax History Compared to Growth
Tax History
| Year | Tax Paid | Tax Assessment Tax Assessment Total Assessment is a certain percentage of the fair market value that is determined by local assessors to be the total taxable value of land and additions on the property. | Land | Improvement |
|---|---|---|---|---|
| 2024 | $2,721 | $68,846 | $8,280 | $60,566 |
| 2023 | $2,374 | $55,185 | $5,772 | $49,413 |
| 2022 | $2,199 | $55,185 | $5,772 | $49,413 |
| 2021 | $1,470 | $43,379 | $5,772 | $37,607 |
| 2020 | $1,841 | $42,245 | $5,772 | $36,473 |
| 2019 | $1,517 | $34,307 | $5,772 | $28,535 |
| 2018 | $1,481 | $33,173 | $5,772 | $27,401 |
| 2017 | $1,446 | $33,173 | $5,772 | $27,401 |
| 2016 | $1,446 | $33,173 | $5,772 | $27,401 |
| 2015 | $615 | $33,173 | $5,772 | $27,401 |
| 2014 | $1,389 | $33,173 | $5,772 | $27,401 |
| 2013 | -- | $33,173 | $5,772 | $27,401 |
Source: Public Records
Map
Nearby Homes
- 00 Seminole Trail
- 1100 Euclid Ave
- 1400 E Cherokee Dr
- 1009 Euclid Ave
- 1002 Baltimore Ave
- 1001 Coral Rd
- 1621 Camellia Dr
- 1205 Dean Dr
- Lot 3 City Blvd
- 907 Euclid Ave
- 1502 Seminole Trail
- 1204 Richmond Ave
- 1011 Cherokee Cir
- 1002 Cherokee Cir
- 1715 City Blvd
- 1103 Kontz Ave
- 1703 Rainbow Dr
- 1100 Atlantic Ave
- 1504 Danora Dr
- 1500 Saint Marys Dr
- 1201 Coral Rd
- 1509 City Blvd
- 1506 Saint Catherine Dr
- 1506 Saint Catherine's Dr
- 1301 Coral Rd
- 0 City Blvd & Atlantic
- 1212 Euclid Ave
- 1506 City Blvd
- 1521 City Blvd
- 1508 Saint Catherine Dr
- 1508 Saint Catherine's Dr
- 1302 Coral Rd
- 1107 Coral Rd
- 1208 Euclid Ave
- 1512 City Blvd
- 1303 Coral Rd
- 1304 Coral Rd
- 1507 Saint Catherine Dr
- 1507 Saint Catherine's Dr
- 1202 Seminole Trail