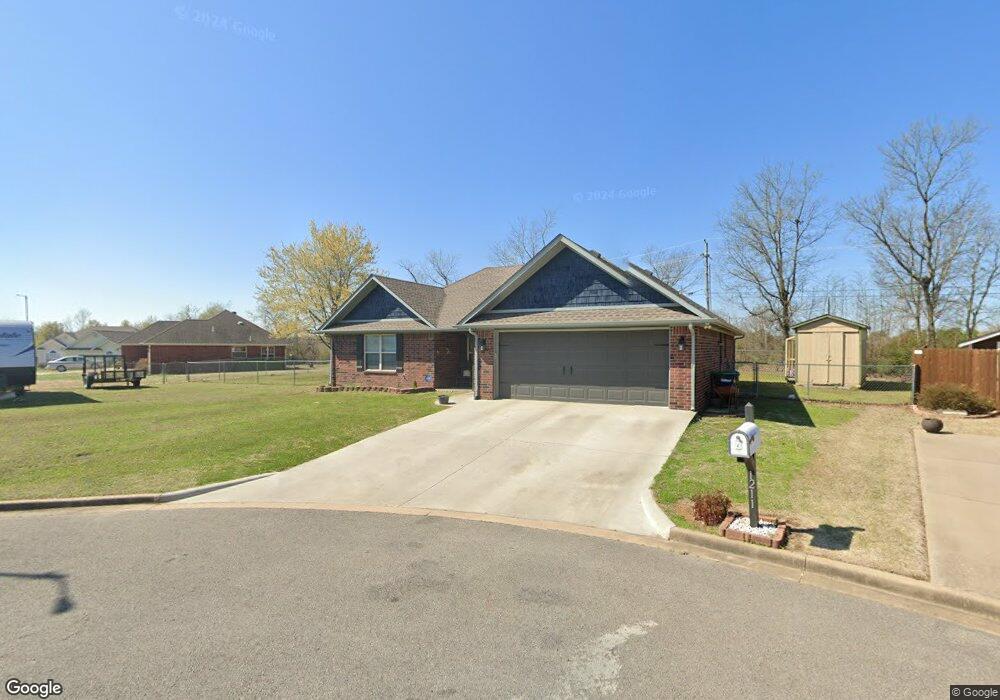
1211 Crystal Ln Tahlequah, OK 74464
Estimated Value: $187,841 - $243,000
3
Beds
2
Baths
1,386
Sq Ft
$156/Sq Ft
Est. Value
About This Home
This home is located at 1211 Crystal Ln, Tahlequah, OK 74464 and is currently estimated at $215,710, approximately $155 per square foot. 1211 Crystal Ln is a home located in Cherokee County with nearby schools including Greenwood Elementary School, Cherokee Elementary School, and Tahlequah Middle School.
Ownership History
Date
Name
Owned For
Owner Type
Purchase Details
Closed on
Feb 18, 2015
Sold by
Hutchens Harold G and Hutchens Earlyne A
Bought by
Crow Amanda D and Crow Brent J
Current Estimated Value
Home Financials for this Owner
Home Financials are based on the most recent Mortgage that was taken out on this home.
Original Mortgage
$20,000
Interest Rate
3.66%
Mortgage Type
New Conventional
Purchase Details
Closed on
Apr 19, 2010
Sold by
Tennison C Katie and Tennison Katie Blair
Bought by
Hutchens Harold G and Hutchens Earlyne A
Home Financials for this Owner
Home Financials are based on the most recent Mortgage that was taken out on this home.
Original Mortgage
$128,837
Interest Rate
4.91%
Mortgage Type
New Conventional
Purchase Details
Closed on
Feb 6, 2003
Sold by
Thomas and Barbara Brinkley
Bought by
Katie Tennison C
Purchase Details
Closed on
Oct 7, 2002
Sold by
Carolyn Littleton Trust
Bought by
Thomas and Barbara Brinkley
Create a Home Valuation Report for This Property
The Home Valuation Report is an in-depth analysis detailing your home's value as well as a comparison with similar homes in the area
Home Values in the Area
Average Home Value in this Area
Purchase History
| Date | Buyer | Sale Price | Title Company |
|---|---|---|---|
| Crow Amanda D | $115,000 | None Available | |
| Hutchens Harold G | $123,500 | None Available | |
| Katie Tennison C | $99,500 | -- | |
| Thomas | $12,000 | -- |
Source: Public Records
Mortgage History
| Date | Status | Borrower | Loan Amount |
|---|---|---|---|
| Closed | Crow Amanda D | $20,000 | |
| Open | Crow Amanda D | $102,718 | |
| Previous Owner | Hutchens Harold G | $128,837 |
Source: Public Records
Tax History Compared to Growth
Tax History
| Year | Tax Paid | Tax Assessment Tax Assessment Total Assessment is a certain percentage of the fair market value that is determined by local assessors to be the total taxable value of land and additions on the property. | Land | Improvement |
|---|---|---|---|---|
| 2025 | $1,610 | $17,836 | $1,819 | $16,017 |
| 2024 | $1,610 | $16,987 | $1,539 | $15,448 |
| 2023 | $1,610 | $16,178 | $1,465 | $14,713 |
| 2022 | $1,406 | $15,150 | $1,100 | $14,050 |
| 2021 | $1,411 | $15,150 | $1,100 | $14,050 |
| 2020 | $1,436 | $15,150 | $1,100 | $14,050 |
| 2019 | $1,357 | $14,437 | $1,100 | $13,337 |
| 2018 | $1,307 | $13,750 | $1,100 | $12,650 |
| 2017 | $1,305 | $13,750 | $1,100 | $12,650 |
| 2016 | $1,313 | $13,750 | $1,100 | $12,650 |
| 2015 | $1,279 | $12,621 | $1,100 | $11,521 |
| 2014 | $1,279 | $13,585 | $1,320 | $12,265 |
Source: Public Records
Map
Nearby Homes
- 1025 W Fox St
- Tbd Unit West Fox Street Tahl
- 1107 Hillcrest Ave
- TBD W Fox St
- 1104 Chase Ave
- 905 Shelley Cir
- 902 S Mission Ave
- 509 W 2nd St
- 516 W Fox St
- 513 S State Ave
- 807 W Choctaw St
- 0 W Choctaw St
- 510 S Cherokee Ave
- 802 S College Ave
- 821 S College Ave
- 528 S Muskogee Ave
- 104 S West Ave
- 224 W Chickasaw St
- 1500 Stickross Mountain Rd
- 757 S Bluff Ave
- 1210 Crystal Ln
- 0 Crystal Rd Unit 1723583
- 1210 Pebbles Ln
- 1209 Crystal Ln
- 1208 Crystal Ln
- 1208 Pebbles Ln
- 1206 Crystal Ln
- 1197 Johnson Ln
- 1206 Pebbles Ln
- 1125 W Fox St
- 1204 Crystal Ln
- 1205 Crystal Ln
- 1211 Pebbles Ln
- 1209 Pebbles Ln
- 1207 Pebbles Ln
- 1210 W 1st St
- 1202 Crystal Ln
- 1203 Crystal Ln
- 1204 Pebbles Ln
- 1208 W 1st St