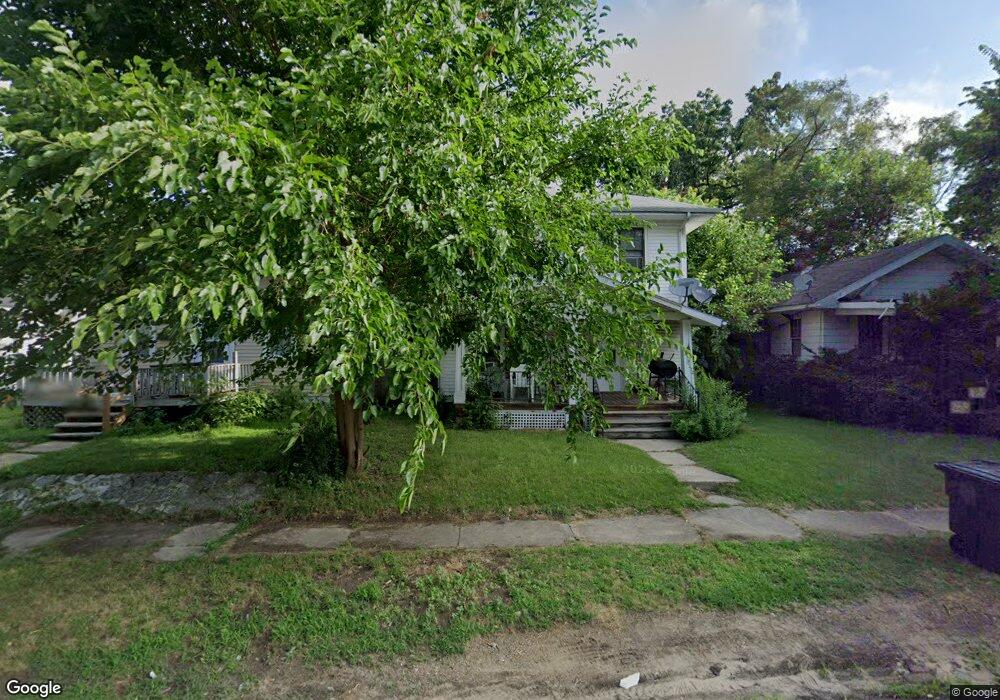
1211 E Fox St South Bend, IN 46613
Estimated Value: $96,000 - $109,686
3
Beds
1
Bath
1,578
Sq Ft
$66/Sq Ft
Est. Value
About This Home
This home is located at 1211 E Fox St, South Bend, IN 46613 and is currently estimated at $103,672, approximately $65 per square foot. 1211 E Fox St is a home located in St. Joseph County with nearby schools including Lincoln Elementary School, Marshall Traditional School, and Clay Intermediate Center.
Ownership History
Date
Name
Owned For
Owner Type
Purchase Details
Closed on
Sep 29, 2014
Sold by
Ma Investments Llc
Bought by
Ewing Holding Llc
Current Estimated Value
Purchase Details
Closed on
Dec 13, 2007
Sold by
Ford Diane L
Bought by
Fannie Mae
Purchase Details
Closed on
May 11, 2006
Sold by
Comunity Wide Federal Cu
Bought by
Ford Dianel L
Home Financials for this Owner
Home Financials are based on the most recent Mortgage that was taken out on this home.
Original Mortgage
$35,700
Interest Rate
6.54%
Mortgage Type
New Conventional
Purchase Details
Closed on
Mar 30, 2006
Sold by
Canarecci Frank
Bought by
Communitywide Federal Credit Union
Home Financials for this Owner
Home Financials are based on the most recent Mortgage that was taken out on this home.
Original Mortgage
$35,700
Interest Rate
6.54%
Mortgage Type
New Conventional
Purchase Details
Closed on
May 10, 2005
Sold by
La Vida Loca Llc
Bought by
Ford Diane L
Purchase Details
Closed on
Apr 18, 2005
Sold by
Norris Randall P
Bought by
La Vida Loca Llc
Create a Home Valuation Report for This Property
The Home Valuation Report is an in-depth analysis detailing your home's value as well as a comparison with similar homes in the area
Purchase History
| Date | Buyer | Sale Price | Title Company |
|---|---|---|---|
| Ewing Holding Llc | -- | -- | |
| Fannie Mae | $45,854 | None Available | |
| Ford Dianel L | -- | Meridian Title Corp | |
| Communitywide Federal Credit Union | $10,000 | None Available | |
| Ford Diane L | -- | None Available | |
| La Vida Loca Llc | -- | None Available |
Source: Public Records
Mortgage History
| Date | Status | Borrower | Loan Amount |
|---|---|---|---|
| Previous Owner | Ford Dianel L | $35,700 |
Source: Public Records
Tax History
| Year | Tax Paid | Tax Assessment Tax Assessment Total Assessment is a certain percentage of the fair market value that is determined by local assessors to be the total taxable value of land and additions on the property. | Land | Improvement |
|---|---|---|---|---|
| 2025 | $1,226 | $62,500 | $1,200 | $61,300 |
| 2024 | $1,001 | $49,900 | $1,200 | $48,700 |
| 2023 | $964 | $39,900 | $1,200 | $38,700 |
| 2022 | $964 | $39,900 | $1,200 | $38,700 |
| 2021 | $999 | $46,000 | $1,200 | $44,800 |
| 2020 | $390 | $14,300 | $1,200 | $13,100 |
| 2019 | $333 | $14,300 | $1,200 | $13,100 |
| 2018 | $388 | $14,300 | $1,200 | $13,100 |
| 2017 | $398 | $14,200 | $1,200 | $13,000 |
| 2016 | $406 | $14,200 | $1,200 | $13,000 |
| 2014 | $420 | $15,900 | $1,200 | $14,700 |
| 2013 | $421 | $40,300 | $2,400 | $37,900 |
Source: Public Records
Map
Nearby Homes
- 1613 Leer St
- 1133 E Donald St
- 1112 E Fox St
- 1410 E Calvert St
- 1339 E Bowman St
- 1726 Leer St
- 1748 Leer St
- 1340 E Calvert St
- 1141 Milton St
- 1148 E Dayton St
- 1144 E Dayton St
- 1516 E Fox St
- 1405 Randolph St
- 922 Milton St
- 822 E Ewing Ave
- 811 E Ewing Ave
- 1618 Marine St
- 1619 Leer St
- 1160 E Indiana Ave
- 809 E Fairview Ave
- 1213 E Fox St
- 1207 E Fox St
- 1217 E Fox St
- 1205 E Fox St
- 1201 E Fox St
- 1212 E Donald St
- 1208 E Donald St
- 1214 E Donald St
- 1223 E Fox St
- 1206 E Donald St
- 1218 E Donald St
- 1202 E Donald St
- 1224 E Donald St
- 1214 E Fox St
- 1208 E Fox St
- 1161 E Fox St
- 1216 E Fox St
- 1206 E Fox St
- 1202 E Fox St
- 1220 E Fox St
Your Personal Tour Guide
Ask me questions while you tour the home.