Estimated Value: $111,000 - $168,000
3
Beds
1
Bath
1,613
Sq Ft
$87/Sq Ft
Est. Value
About This Home
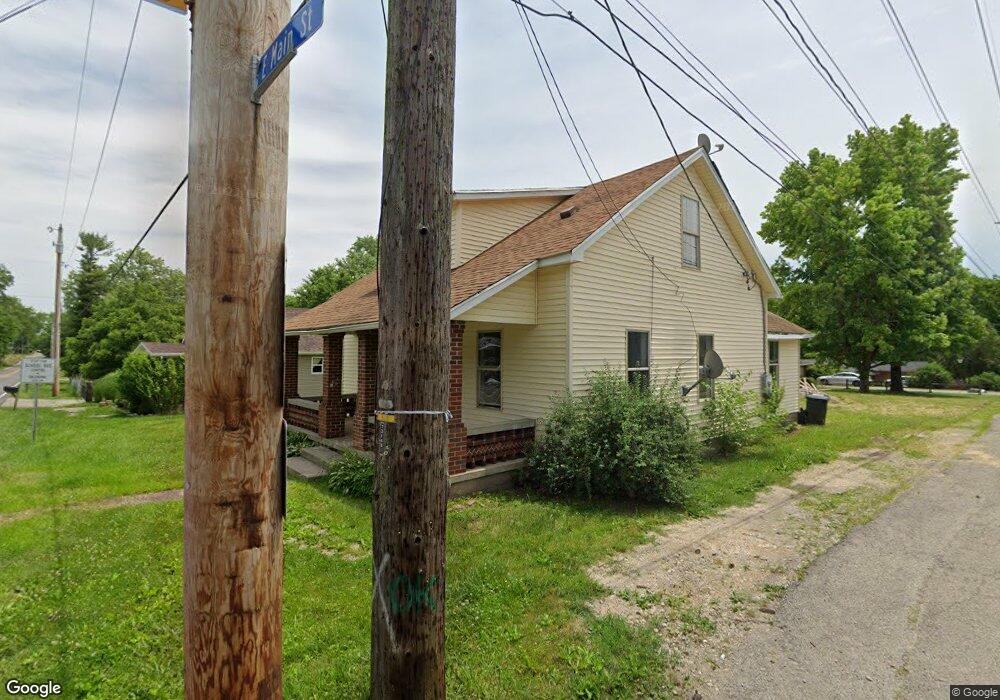
This home is located at 1211 E Main St, Xenia, OH 45385 and is currently estimated at $140,761, approximately $87 per square foot. 1211 E Main St is a home located in Greene County with nearby schools including Xenia High School, Summit Academy Community School for Alternative Learners - Xenia, and Legacy Christian Academy.
Ownership History
Date
Name
Owned For
Owner Type
Purchase Details
Closed on
Mar 5, 2009
Sold by
Secretary Of Housing & Urban Development
Bought by
Gary L Wallman Llc
Current Estimated Value
Purchase Details
Closed on
Oct 30, 2008
Sold by
Daines Kelly J and Smith Gerald L
Bought by
Secretary Of Housing & Urban Development
Purchase Details
Closed on
May 26, 2004
Sold by
Graham Bobby D and Graham Teresa L
Bought by
Daines Kelly J
Home Financials for this Owner
Home Financials are based on the most recent Mortgage that was taken out on this home.
Original Mortgage
$63,945
Interest Rate
5.91%
Mortgage Type
FHA
Purchase Details
Closed on
Jan 16, 2002
Sold by
Estate Of Sandra K Graham
Bought by
Graham Bobby D
Purchase Details
Closed on
Nov 8, 2001
Sold by
Estate Of David J Graham
Bought by
Graham Sandra K
Create a Home Valuation Report for This Property
The Home Valuation Report is an in-depth analysis detailing your home's value as well as a comparison with similar homes in the area
Home Values in the Area
Average Home Value in this Area
Purchase History
| Date | Buyer | Sale Price | Title Company |
|---|---|---|---|
| Gary L Wallman Llc | $27,112 | Lakeside Title & Escrow Agen | |
| Secretary Of Housing & Urban Development | -- | Allodicl Title | |
| Daines Kelly J | $64,700 | -- | |
| Graham Bobby D | -- | -- | |
| Graham Sandra K | -- | -- |
Source: Public Records
Mortgage History
| Date | Status | Borrower | Loan Amount |
|---|---|---|---|
| Previous Owner | Daines Kelly J | $63,945 |
Source: Public Records
Tax History Compared to Growth
Tax History
| Year | Tax Paid | Tax Assessment Tax Assessment Total Assessment is a certain percentage of the fair market value that is determined by local assessors to be the total taxable value of land and additions on the property. | Land | Improvement |
|---|---|---|---|---|
| 2024 | $1,242 | $29,030 | $1,320 | $27,710 |
| 2023 | $1,242 | $29,030 | $1,320 | $27,710 |
| 2022 | $1,030 | $20,530 | $1,200 | $19,330 |
| 2021 | $1,044 | $20,530 | $1,200 | $19,330 |
| 2020 | $1,000 | $20,530 | $1,200 | $19,330 |
| 2019 | $922 | $17,810 | $1,400 | $16,410 |
| 2018 | $925 | $17,810 | $1,400 | $16,410 |
| 2017 | $899 | $17,810 | $1,400 | $16,410 |
| 2016 | $903 | $17,060 | $1,400 | $15,660 |
| 2015 | $906 | $17,060 | $1,400 | $15,660 |
| 2014 | $867 | $17,060 | $1,400 | $15,660 |
Source: Public Records
Map
Nearby Homes
- 1293 E Main St
- 0 N Patton St
- 00 N Patton St
- 612 E Market St
- 607 E Main St
- 454 E Church St
- 116 N Leach St
- 0 Gultice Rd Unit 940427
- 1444 Triple Crown Way
- 447 S Stadium Dr
- 745 Doral Dr
- 323 E Church St
- 610 Saxony Dr
- 479 N Stadium Dr
- 513 Redbud Ln
- 133 Hivling St
- 119 Park Dr
- 1239 Old U S 35
- 75 W 2nd St
- 98 W 3rd St