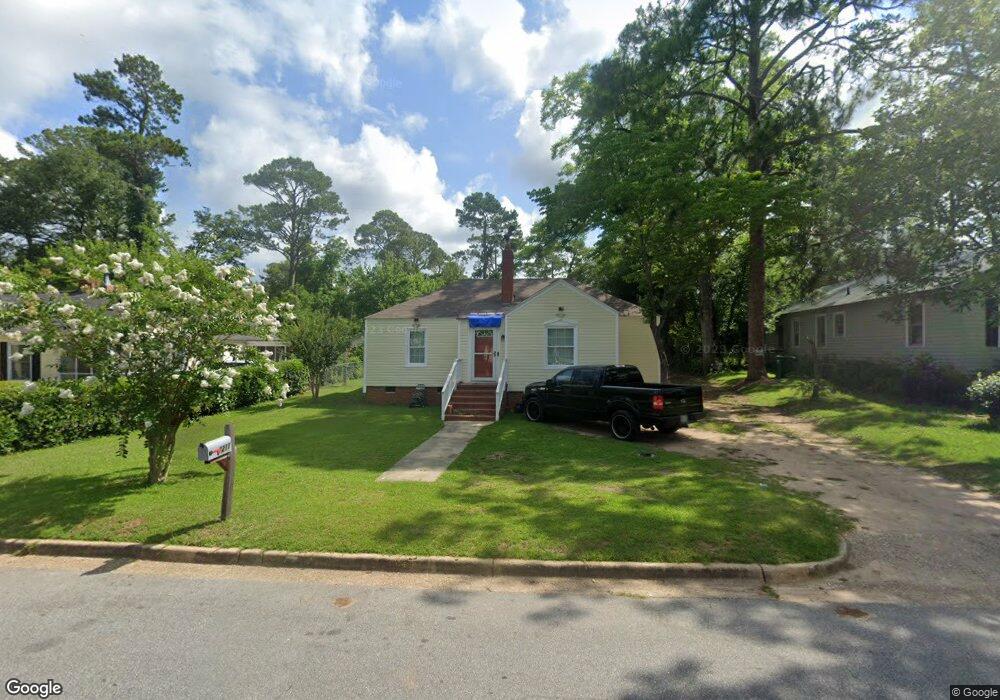
1211 Eager Dr Albany, GA 31707
Eudgemar NeighborhoodEstimated Value: $81,000 - $103,835
3
Beds
2
Baths
1,213
Sq Ft
$77/Sq Ft
Est. Value
About This Home
This home is located at 1211 Eager Dr, Albany, GA 31707 and is currently estimated at $93,959, approximately $77 per square foot. 1211 Eager Dr is a home located in Dougherty County with nearby schools including Sherwood Acres Elementary School, Merry Acres Middle School, and Westover High School.
Ownership History
Date
Name
Owned For
Owner Type
Purchase Details
Closed on
Sep 9, 2019
Sold by
Yalamanchili Gandhiji
Bought by
Clay Chaunletta and Clay Detric
Current Estimated Value
Home Financials for this Owner
Home Financials are based on the most recent Mortgage that was taken out on this home.
Original Mortgage
$66,039
Outstanding Balance
$22,606
Interest Rate
3.6%
Mortgage Type
New Conventional
Estimated Equity
$71,353
Purchase Details
Closed on
Jan 2, 2018
Sold by
Moore Danny
Bought by
Gogenini Samrajya Lk and Yalamanchili Gandhiji
Purchase Details
Closed on
Sep 14, 2012
Sold by
Bentley Jan Sapp
Bought by
Moore Danny
Purchase Details
Closed on
Dec 13, 1998
Sold by
Sapp Clarence C
Bought by
Sapp Claire M
Purchase Details
Closed on
Mar 25, 1994
Sold by
Ruehl Edwin D and Ruehl Marjorie C
Bought by
Sapp Sapp C and Sapp Claire M
Purchase Details
Closed on
Jun 20, 1974
Sold by
Henderson Joe Ed
Bought by
Ruehl Erwin H Etal
Create a Home Valuation Report for This Property
The Home Valuation Report is an in-depth analysis detailing your home's value as well as a comparison with similar homes in the area
Home Values in the Area
Average Home Value in this Area
Purchase History
| Date | Buyer | Sale Price | Title Company |
|---|---|---|---|
| Clay Chaunletta | $65,000 | -- | |
| Gogenini Samrajya Lk | $26,001 | -- | |
| Moore Danny | $26,678 | -- | |
| Sapp Claire M | -- | -- | |
| Sapp Sapp C | $30,500 | -- | |
| Ruehl Erwin H Etal | -- | -- |
Source: Public Records
Mortgage History
| Date | Status | Borrower | Loan Amount |
|---|---|---|---|
| Open | Clay Chaunletta | $66,039 |
Source: Public Records
Tax History
| Year | Tax Paid | Tax Assessment Tax Assessment Total Assessment is a certain percentage of the fair market value that is determined by local assessors to be the total taxable value of land and additions on the property. | Land | Improvement |
|---|---|---|---|---|
| 2025 | $1,325 | $26,160 | $4,920 | $21,240 |
| 2024 | $1,325 | $25,760 | $4,920 | $20,840 |
| 2023 | $1,200 | $25,760 | $4,920 | $20,840 |
| 2022 | $1,205 | $25,760 | $4,920 | $20,840 |
| 2021 | $1,117 | $25,760 | $4,920 | $20,840 |
| 2020 | $1,119 | $25,760 | $4,920 | $20,840 |
| 2019 | $851 | $19,520 | $4,920 | $14,600 |
| 2018 | $855 | $19,520 | $4,920 | $14,600 |
| 2017 | $797 | $19,520 | $4,920 | $14,600 |
| 2016 | $797 | $19,520 | $4,920 | $14,600 |
| 2015 | $799 | $19,520 | $4,920 | $14,600 |
| 2014 | $789 | $19,520 | $4,920 | $14,600 |
Source: Public Records
Map
Nearby Homes
- 603 Lucille St
- 1301 Eager Dr
- 1212 Baker Ave
- 1217 Maryland Dr
- 810 Baldwin Dr
- 523 Eugemar Dr
- 1218 W 2nd Ave
- 1214 W 2nd Ave
- 1213 W 2nd Ave
- 1302 W 3rd Ave
- 1603 Maryland Dr
- 506 Eugemar Dr
- 511 Florence Dr
- 502 Eugemar Dr
- 1013 Rosedale Ave
- 615 Haley St
- 511 Baldwin Dr
- 1108 A/B Fourth Ave
- 1305 W 4th Ave
- 1307 W 4th Ave
Your Personal Tour Guide
Ask me questions while you tour the home.