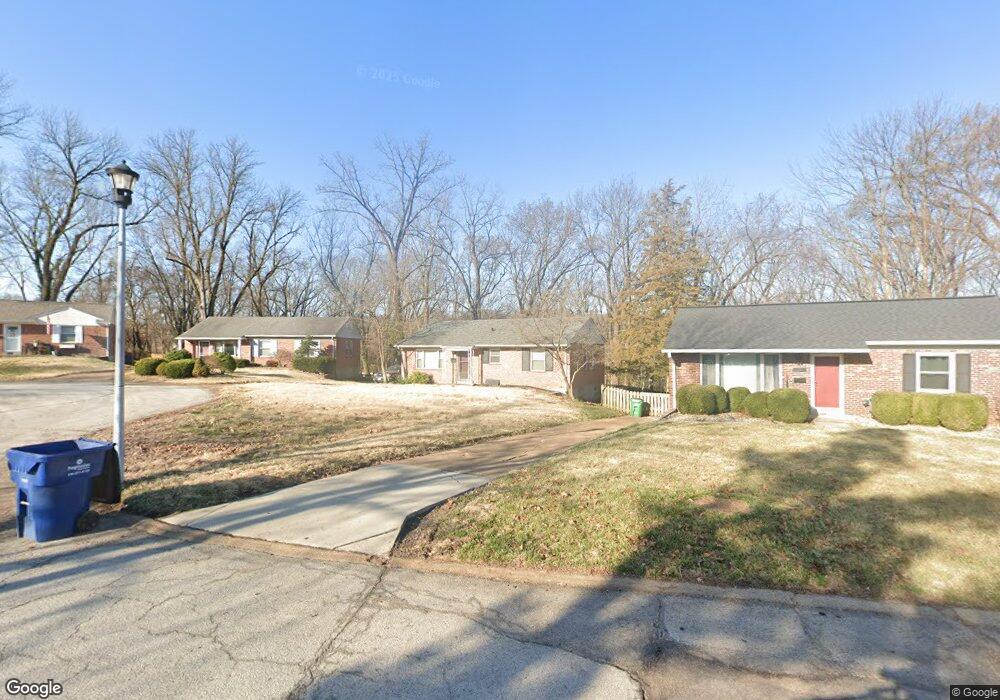
1211 Kenyon Ct Saint Louis, MO 63119
Estimated Value: $221,360 - $287,000
2
Beds
1
Bath
720
Sq Ft
$340/Sq Ft
Est. Value
About This Home
This home is located at 1211 Kenyon Ct, Saint Louis, MO 63119 and is currently estimated at $244,590, approximately $339 per square foot. 1211 Kenyon Ct is a home located in St. Louis County with nearby schools including Hudson Elementary School, Hixson Middle School, and Webster Groves High School.
Ownership History
Date
Name
Owned For
Owner Type
Purchase Details
Closed on
Oct 28, 2019
Sold by
Suchaner Daniel Patrick and Suchanek Daniel Patrick
Bought by
Suchanek Daniel Patrick
Current Estimated Value
Home Financials for this Owner
Home Financials are based on the most recent Mortgage that was taken out on this home.
Original Mortgage
$78,500
Outstanding Balance
$52,599
Interest Rate
3.7%
Mortgage Type
New Conventional
Estimated Equity
$191,991
Purchase Details
Closed on
Dec 30, 2005
Sold by
Rheinnecker Olive and Rheinnecker Alfred O
Bought by
Suchaner Daniel Patrick
Home Financials for this Owner
Home Financials are based on the most recent Mortgage that was taken out on this home.
Original Mortgage
$18,750
Interest Rate
5.78%
Mortgage Type
Fannie Mae Freddie Mac
Create a Home Valuation Report for This Property
The Home Valuation Report is an in-depth analysis detailing your home's value as well as a comparison with similar homes in the area
Home Values in the Area
Average Home Value in this Area
Purchase History
| Date | Buyer | Sale Price | Title Company |
|---|---|---|---|
| Suchanek Daniel Patrick | -- | Pinnacle Title Agency | |
| Suchaner Daniel Patrick | $125,000 | None Available |
Source: Public Records
Mortgage History
| Date | Status | Borrower | Loan Amount |
|---|---|---|---|
| Open | Suchanek Daniel Patrick | $78,500 | |
| Closed | Suchaner Daniel Patrick | $18,750 | |
| Closed | Suchaner Daniel Patrick | $100,000 |
Source: Public Records
Tax History Compared to Growth
Tax History
| Year | Tax Paid | Tax Assessment Tax Assessment Total Assessment is a certain percentage of the fair market value that is determined by local assessors to be the total taxable value of land and additions on the property. | Land | Improvement |
|---|---|---|---|---|
| 2025 | $2,688 | $40,360 | $29,830 | $10,530 |
| 2024 | $2,688 | $37,220 | $20,880 | $16,340 |
| 2023 | $2,719 | $37,220 | $20,880 | $16,340 |
| 2022 | $2,650 | $33,860 | $20,880 | $12,980 |
| 2021 | $2,633 | $33,860 | $20,880 | $12,980 |
| 2020 | $2,418 | $29,700 | $17,900 | $11,800 |
| 2019 | $2,404 | $29,700 | $17,900 | $11,800 |
| 2018 | $2,108 | $22,840 | $13,470 | $9,370 |
| 2017 | $2,097 | $22,840 | $13,470 | $9,370 |
| 2016 | $2,198 | $22,860 | $11,570 | $11,290 |
| 2015 | $2,120 | $22,860 | $11,570 | $11,290 |
| 2014 | $2,299 | $24,170 | $9,120 | $15,050 |
Source: Public Records
Map
Nearby Homes
- 9780 Old Warson Rd
- 9844 Oak Haven Ave
- 9839 Warson Pointe Dr
- 1119 Gilbert Ave
- 9840 Oak Haven Ave
- 1120 Gilbert Ave
- 1322 Kortwright Ave
- 1146 Kortwright Ave
- 1105 Timberlane Dr
- 1025 North Dr
- 1048 Martha Ln
- 9714 Whitestone Terrace
- 65 Ridge Line Dr
- 1235 Charlane Ct
- 1629 Andrew Dr
- 9721 Greenwood Terrace
- 1242 Charlane Ct
- 1509 Andrew Dr
- 24 Daniel Rd
- 2642 McKnight Crossing Ct
- 1213 Kenyon Ct
- 9910 Kenyon Ct
- 1215 Kenyon Ct
- 9908 Kenyon Ct
- 9906 Kenyon Ct
- 1214 Kenyon Ct
- 1217 Kenyon Ct
- 9904 Kenyon Ct
- 1216 Kenyon Ct
- 9902 Kenyon Ct
- 1219 Kenyon Ct
- 9941 Oak Haven Ave
- 9931 Oak Haven Ave
- 9904 Boulder Ct
- 9901 Kenyon Ct
- 1214 Des Peres Ave
- 1212 Des Peres Ave
- 1215 Gilbert Ave
- 1216 Des Peres Ave
- 9921 Oak Haven Ave