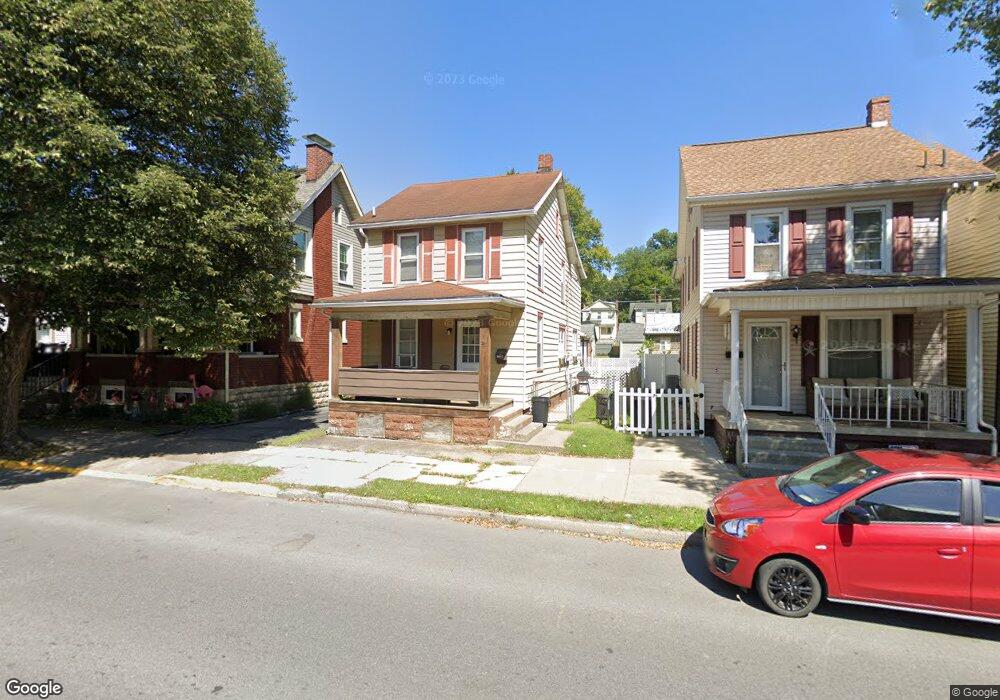
1211 Moore St Huntingdon, PA 16652
Estimated Value: $75,992 - $133,000
3
Beds
--
Bath
952
Sq Ft
$114/Sq Ft
Est. Value
About This Home
This home is located at 1211 Moore St, Huntingdon, PA 16652 and is currently estimated at $108,998, approximately $114 per square foot. 1211 Moore St is a home located in Huntingdon County with nearby schools including Huntingdon Area Senior High School, New Day Charter School, and Calvary Christian Academy.
Ownership History
Date
Name
Owned For
Owner Type
Purchase Details
Closed on
Aug 6, 2021
Sold by
Lang Benjamin P
Bought by
Wrangler Services Llc
Current Estimated Value
Purchase Details
Closed on
Mar 24, 2017
Sold by
Sloan Ronald E
Bought by
Lang Benjamin P
Home Financials for this Owner
Home Financials are based on the most recent Mortgage that was taken out on this home.
Original Mortgage
$28,000
Interest Rate
4.17%
Mortgage Type
Commercial
Create a Home Valuation Report for This Property
The Home Valuation Report is an in-depth analysis detailing your home's value as well as a comparison with similar homes in the area
Home Values in the Area
Average Home Value in this Area
Purchase History
| Date | Buyer | Sale Price | Title Company |
|---|---|---|---|
| Wrangler Services Llc | $67,500 | None Available | |
| Lang Benjamin P | $35,000 | None Available |
Source: Public Records
Mortgage History
| Date | Status | Borrower | Loan Amount |
|---|---|---|---|
| Previous Owner | Lang Benjamin P | $28,000 |
Source: Public Records
Tax History Compared to Growth
Tax History
| Year | Tax Paid | Tax Assessment Tax Assessment Total Assessment is a certain percentage of the fair market value that is determined by local assessors to be the total taxable value of land and additions on the property. | Land | Improvement |
|---|---|---|---|---|
| 2024 | $1,478 | $14,720 | $1,520 | $13,200 |
| 2023 | $1,348 | $14,720 | $1,520 | $13,200 |
| 2022 | $1,321 | $14,720 | $1,520 | $13,200 |
| 2021 | $1,283 | $14,720 | $1,520 | $13,200 |
| 2020 | $1,261 | $14,720 | $1,520 | $13,200 |
| 2019 | $1,187 | $14,720 | $1,520 | $13,200 |
| 2018 | $1,167 | $14,720 | $1,520 | $13,200 |
| 2017 | $1,118 | $14,720 | $1,520 | $13,200 |
| 2016 | $108 | $14,720 | $1,520 | $13,200 |
| 2015 | $1,059 | $14,720 | $1,520 | $13,200 |
| 2014 | -- | $14,720 | $1,520 | $13,200 |
Source: Public Records
Map
Nearby Homes