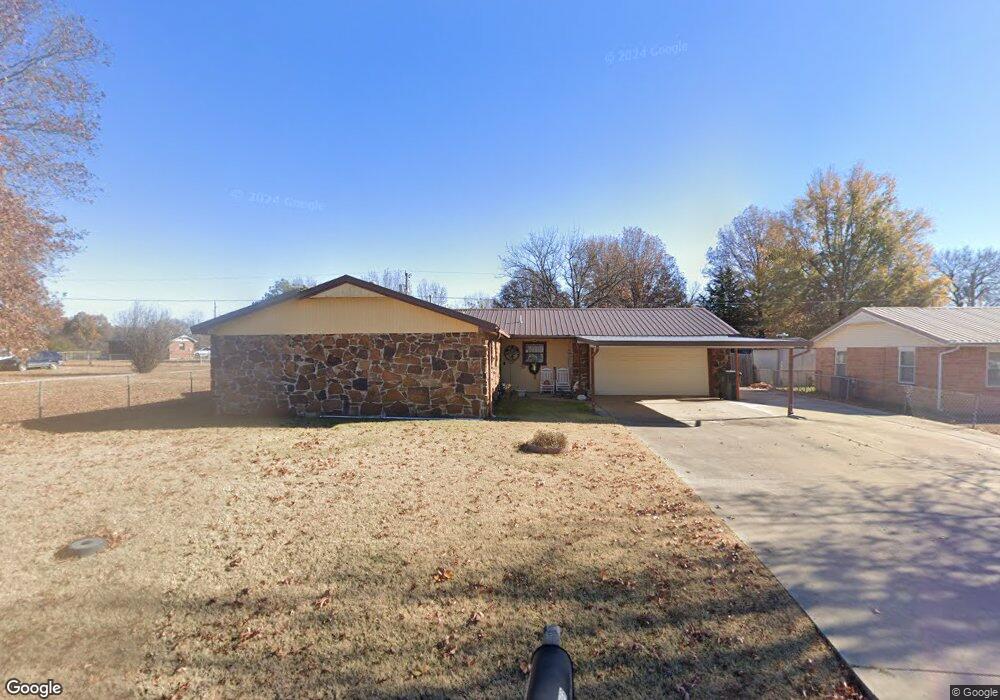
1211 N Kern Ave Okmulgee, OK 74447
Estimated Value: $98,000 - $224,000
3
Beds
2
Baths
1,304
Sq Ft
$109/Sq Ft
Est. Value
About This Home
This home is located at 1211 N Kern Ave, Okmulgee, OK 74447 and is currently estimated at $141,920, approximately $108 per square foot. 1211 N Kern Ave is a home located in Okmulgee County with nearby schools including Okmulgee Primary School, Okmulgee Middle School, and Dunbar Elementary School.
Ownership History
Date
Name
Owned For
Owner Type
Purchase Details
Closed on
Jan 4, 2017
Sold by
Hamon Larry W and Hamon Vivian L
Bought by
Salyer Kathy L
Current Estimated Value
Purchase Details
Closed on
Apr 27, 2015
Sold by
Baker Terry L and Baker Les
Bought by
Hamon Larry W and Hamon Vivian L
Home Financials for this Owner
Home Financials are based on the most recent Mortgage that was taken out on this home.
Original Mortgage
$44,167
Interest Rate
3.84%
Mortgage Type
Purchase Money Mortgage
Purchase Details
Closed on
Mar 30, 2015
Sold by
Hamon Louise Loy
Bought by
Hamon Vivian L and Hamon Larry W
Home Financials for this Owner
Home Financials are based on the most recent Mortgage that was taken out on this home.
Original Mortgage
$44,167
Interest Rate
3.84%
Mortgage Type
Purchase Money Mortgage
Purchase Details
Closed on
Mar 16, 2001
Sold by
Hamon Louise
Bought by
Hamon Larry W Terry and Hamon Larry W Hamon K
Create a Home Valuation Report for This Property
The Home Valuation Report is an in-depth analysis detailing your home's value as well as a comparison with similar homes in the area
Home Values in the Area
Average Home Value in this Area
Purchase History
| Date | Buyer | Sale Price | Title Company |
|---|---|---|---|
| Salyer Kathy L | -- | None Available | |
| Hamon Larry W | -- | None Available | |
| Hamon Vivian L | -- | None Available | |
| Hamon Larry W Terry | -- | -- | |
| Hamon Larry W | -- | None Available |
Source: Public Records
Mortgage History
| Date | Status | Borrower | Loan Amount |
|---|---|---|---|
| Previous Owner | Hamon Larry W | $44,167 |
Source: Public Records
Tax History Compared to Growth
Tax History
| Year | Tax Paid | Tax Assessment Tax Assessment Total Assessment is a certain percentage of the fair market value that is determined by local assessors to be the total taxable value of land and additions on the property. | Land | Improvement |
|---|---|---|---|---|
| 2025 | $855 | $10,332 | $360 | $9,972 |
| 2024 | $818 | $10,031 | $360 | $9,671 |
| 2023 | $783 | $10,031 | $360 | $9,671 |
| 2022 | $848 | $10,031 | $360 | $9,671 |
| 2021 | $887 | $10,031 | $360 | $9,671 |
| 2020 | $849 | $9,599 | $360 | $9,239 |
| 2019 | $877 | $9,931 | $360 | $9,571 |
| 2018 | $903 | $10,096 | $360 | $9,736 |
| 2017 | $909 | $10,261 | $360 | $9,901 |
| 2016 | $879 | $9,905 | $360 | $9,545 |
| 2015 | $438 | $7,083 | $360 | $6,723 |
| 2014 | $441 | $7,083 | $360 | $6,723 |
Source: Public Records
Map
Nearby Homes
- 1026 N Kern Ave
- 0 N Sherman Ave
- 1401 N Griffin St
- 813 N Kern Ave
- 1101 N Collins Ave
- 1106 N Alabama Ave
- 1400 W Seneca St
- 910 N Collins Ave
- 908 N Collins Ave
- 704 N Sherman Ave
- 804 N Griffin Ave
- 700 N Sherman Ave
- 400 Yuchi Dr
- 804 N Alabama Ave
- 602 N Collins Ave
- 530 N Okmulgee Ave
- 0 N Oklahoma Ave
- 305 N Taft Ave
- 0096 State Highway 56
- 809 N Grand Ave
- 1209 N Kern Ave
- 1212 N Sherman Ave
- 1207 N Kern Ave
- 1216 N Sherman Ave
- 1303 W Lagonda St
- 1210 N Sherman Ave
- 1205 N Kern Ave
- 1212 N Kern Ave
- 1208 N Sherman Ave
- 1203 N Kern Ave
- 1209 N Sherman Ave
- 1213 N Sherman Ave
- 1311 N Kern Ave
- 1215 N Sherman Ave
- 1207 N Sherman Ave
- 1200 N Kern Ave
- 1201 N Kern Ave
- 1205 N Sherman Ave
- 1101 W Melrose St
- 1305 W Lagonda St