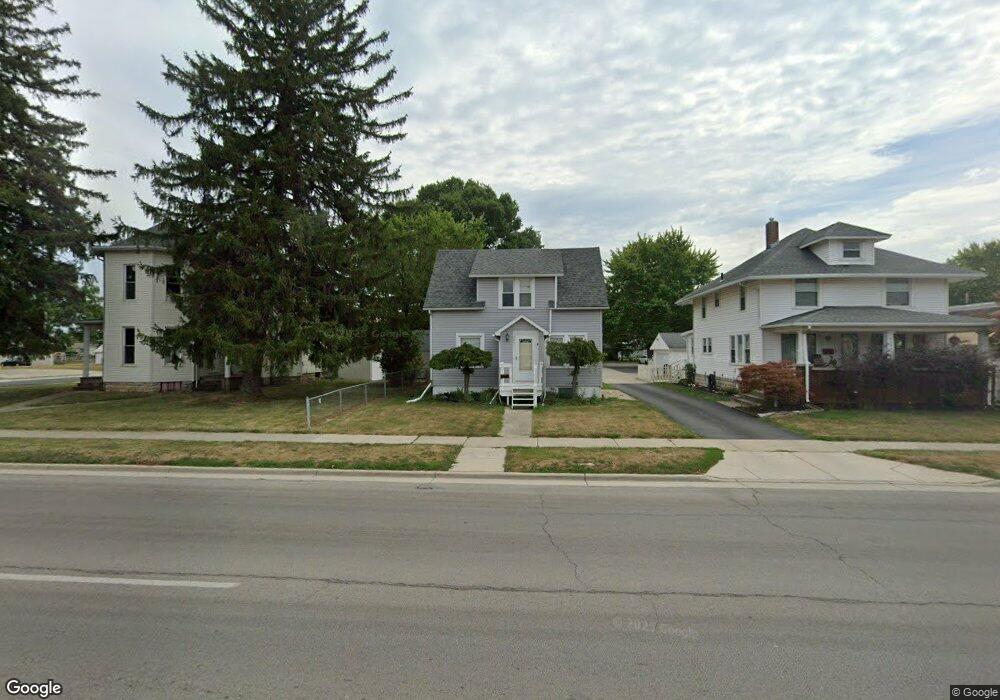
1211 N Main St Findlay, OH 45840
Estimated Value: $135,000 - $145,000
2
Beds
1
Bath
893
Sq Ft
$157/Sq Ft
Est. Value
About This Home
This home is located at 1211 N Main St, Findlay, OH 45840 and is currently estimated at $140,093, approximately $156 per square foot. 1211 N Main St is a home located in Hancock County with nearby schools including Whittier Primary School, Bigelow Hill Elementary School, and Glenwood Middle School.
Ownership History
Date
Name
Owned For
Owner Type
Purchase Details
Closed on
Jan 15, 2020
Sold by
Petrime Gary R and Petrime Kimberly K
Bought by
Petrime Gary R and Petrime Kimberly K
Current Estimated Value
Purchase Details
Closed on
Aug 1, 2000
Sold by
Toth Robert J
Bought by
Petrime Gary R and Petrime Kimberly K
Purchase Details
Closed on
May 23, 1995
Sold by
Hackerd J Darlene
Bought by
Robert & Francis Toth Trustee
Purchase Details
Closed on
Jun 25, 1990
Bought by
Hackerd J Darlene
Purchase Details
Closed on
Oct 31, 1989
Bought by
Hackerd Richard A
Purchase Details
Closed on
Nov 2, 1988
Bought by
Wittenmyer Michael E
Create a Home Valuation Report for This Property
The Home Valuation Report is an in-depth analysis detailing your home's value as well as a comparison with similar homes in the area
Home Values in the Area
Average Home Value in this Area
Purchase History
| Date | Buyer | Sale Price | Title Company |
|---|---|---|---|
| Petrime Gary R | -- | None Available | |
| Petrime Gary R | $53,000 | -- | |
| Robert & Francis Toth Trustee | $45,000 | -- | |
| Hackerd J Darlene | -- | -- | |
| Hackerd Richard A | $35,000 | -- | |
| Wittenmyer Michael E | $29,000 | -- |
Source: Public Records
Tax History Compared to Growth
Tax History
| Year | Tax Paid | Tax Assessment Tax Assessment Total Assessment is a certain percentage of the fair market value that is determined by local assessors to be the total taxable value of land and additions on the property. | Land | Improvement |
|---|---|---|---|---|
| 2024 | $1,385 | $38,000 | $4,300 | $33,700 |
| 2023 | $1,388 | $38,000 | $4,300 | $33,700 |
| 2022 | $1,383 | $38,000 | $4,300 | $33,700 |
| 2021 | $1,616 | $38,680 | $4,320 | $34,360 |
| 2020 | $1,615 | $38,680 | $4,320 | $34,360 |
| 2019 | $1,584 | $38,680 | $4,320 | $34,360 |
| 2018 | $1,483 | $33,230 | $3,920 | $29,310 |
| 2017 | $1,484 | $33,230 | $3,920 | $29,310 |
| 2016 | $1,470 | $33,230 | $3,920 | $29,310 |
| 2015 | $1,079 | $24,000 | $4,270 | $19,730 |
| 2014 | $1,080 | $24,000 | $4,270 | $19,730 |
| 2012 | $1,088 | $24,000 | $4,270 | $19,730 |
Source: Public Records
Map
Nearby Homes
- 206 Midland Ave
- 115 George St
- 230 Midland Ave
- 334 E Foulke Ave
- 420 Allen Ave
- 1820 N Main St
- 1825 Pershing St
- 410 Monroe Ave
- 706 N Cory St
- 207 Ash Ave
- 405 Clifton Ave
- 533 Davis St
- 304 Rector Ave
- 247 Crystal Ave
- 1934 Geffs Ave
- 604 Davis St
- 224 Defiance Ave
- 304 Prentiss Ave
- 524 Defiance Ave
- 715 Christina Ct
- 1209 N Main St
- 1219 N Main St
- 1219 N Main St
- 1217 N Main St
- 116 Midland Ave
- 119 Allen Ave
- 123 Allen Ave
- 124 Midland Ave
- 127 Allen Ave
- 126 Midland Ave
- 122 Allen Ave
- 1123 N Main St
- 126 Allen Ave
- 133 Allen Ave
- 130 Midland Ave
- 119 Midland Ave
- 124 Allen Ave
- 123 Midland Ave
- 123 Midland Ave Unit B
- 136 Midland Ave