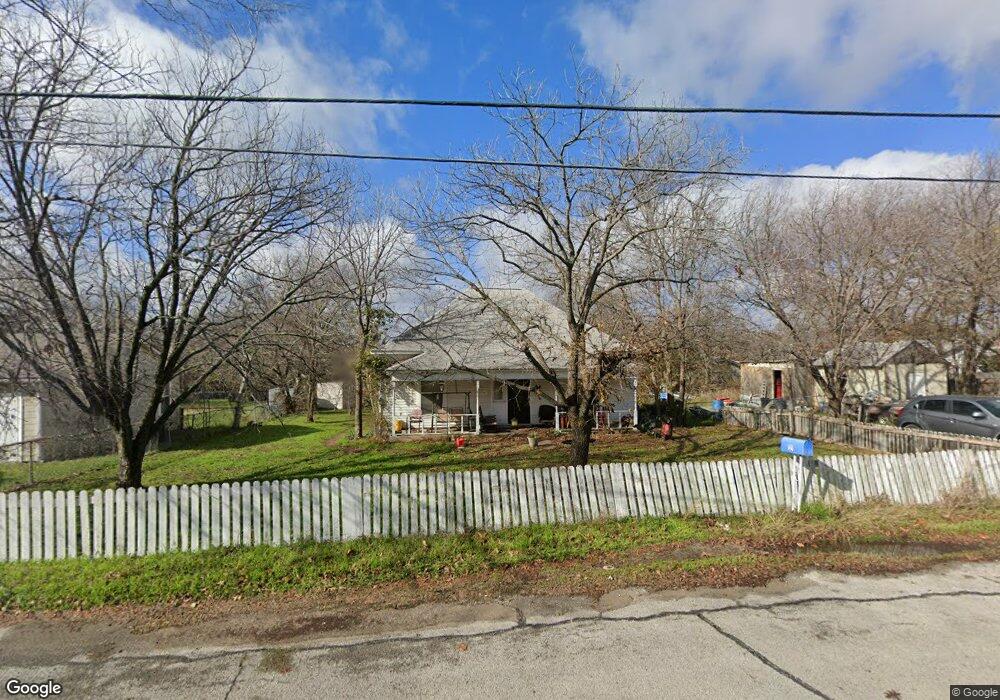
1211 N Rusk St Weatherford, TX 76086
Estimated Value: $204,829 - $257,000
--
Bed
--
Bath
1,188
Sq Ft
$194/Sq Ft
Est. Value
About This Home
This home is located at 1211 N Rusk St, Weatherford, TX 76086 and is currently estimated at $230,707, approximately $194 per square foot. 1211 N Rusk St is a home located in Parker County with nearby schools including Seguin Elementary School, Tison Middle School, and Weatherford High School.
Ownership History
Date
Name
Owned For
Owner Type
Purchase Details
Closed on
Aug 1, 2019
Sold by
Zielinski Merla R and Zielinski Kenneth R
Bought by
Dunagan Clinton D and Dunagan Jennifer L
Current Estimated Value
Home Financials for this Owner
Home Financials are based on the most recent Mortgage that was taken out on this home.
Original Mortgage
$39,200
Interest Rate
3.65%
Mortgage Type
Seller Take Back
Purchase Details
Closed on
Oct 6, 2004
Sold by
Hud
Bought by
Zielinski Merla R and Zielinski Kenneth R
Purchase Details
Closed on
Mar 2, 2004
Sold by
Mortgage Elec Reg Systems Inc
Bought by
Zielinski Merla R and Zielinski Kenneth R
Purchase Details
Closed on
Feb 22, 2000
Sold by
Roberts Herbert M
Bought by
Zielinski Merla R and Zielinski Kenneth R
Create a Home Valuation Report for This Property
The Home Valuation Report is an in-depth analysis detailing your home's value as well as a comparison with similar homes in the area
Home Values in the Area
Average Home Value in this Area
Purchase History
| Date | Buyer | Sale Price | Title Company |
|---|---|---|---|
| Dunagan Clinton D | -- | None Available | |
| Zielinski Merla R | -- | -- | |
| Zielinski Merla R | -- | -- | |
| Zielinski Merla R | -- | -- |
Source: Public Records
Mortgage History
| Date | Status | Borrower | Loan Amount |
|---|---|---|---|
| Previous Owner | Dunagan Clinton D | $39,200 |
Source: Public Records
Tax History Compared to Growth
Tax History
| Year | Tax Paid | Tax Assessment Tax Assessment Total Assessment is a certain percentage of the fair market value that is determined by local assessors to be the total taxable value of land and additions on the property. | Land | Improvement |
|---|---|---|---|---|
| 2025 | $864 | $106,625 | -- | -- |
| 2024 | $864 | $96,932 | -- | -- |
| 2023 | $864 | $88,120 | $0 | $0 |
| 2022 | $1,777 | $80,110 | $15,000 | $65,110 |
| 2021 | $1,924 | $80,110 | $15,000 | $65,110 |
| 2020 | $1,714 | $70,920 | $15,000 | $55,920 |
| 2019 | $1,811 | $70,920 | $15,000 | $55,920 |
| 2018 | $1,603 | $62,510 | $15,000 | $47,510 |
| 2017 | $1,645 | $62,510 | $15,000 | $47,510 |
| 2016 | $1,373 | $52,190 | $15,000 | $37,190 |
| 2015 | $1,345 | $52,190 | $15,000 | $37,190 |
| 2014 | $1,231 | $49,000 | $15,000 | $34,000 |
Source: Public Records
Map
Nearby Homes