1211 Randolph St South Bend, IN 46613
2
Beds
1
Bath
660
Sq Ft
5,663
Sq Ft Lot
About This Home
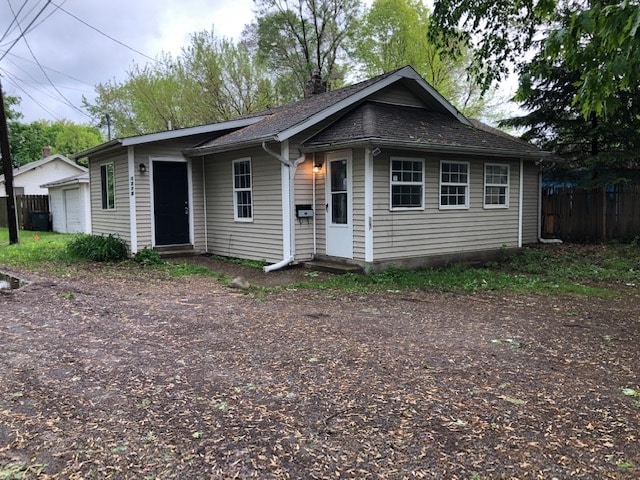
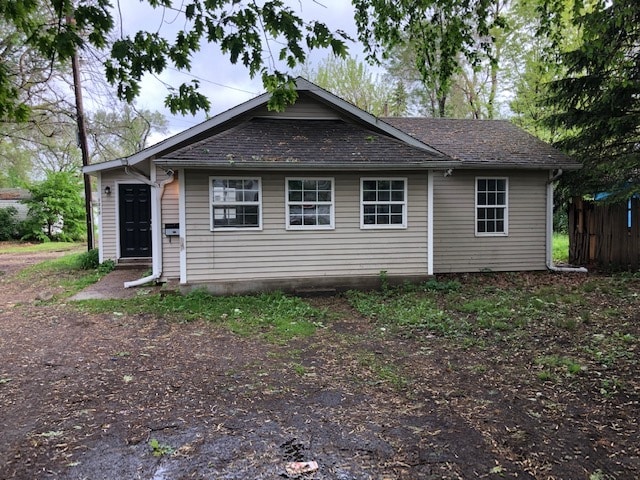
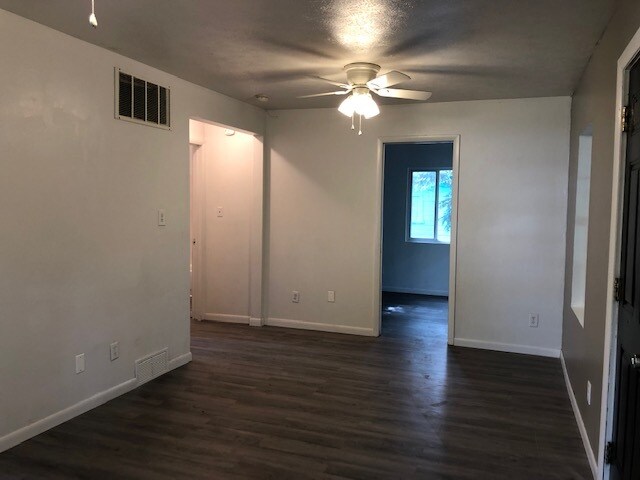
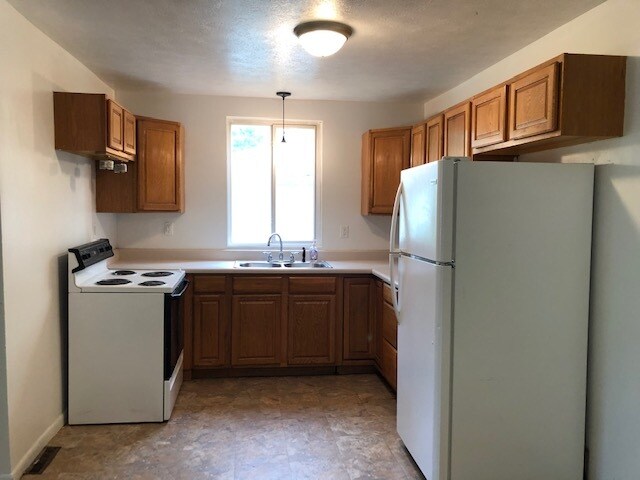
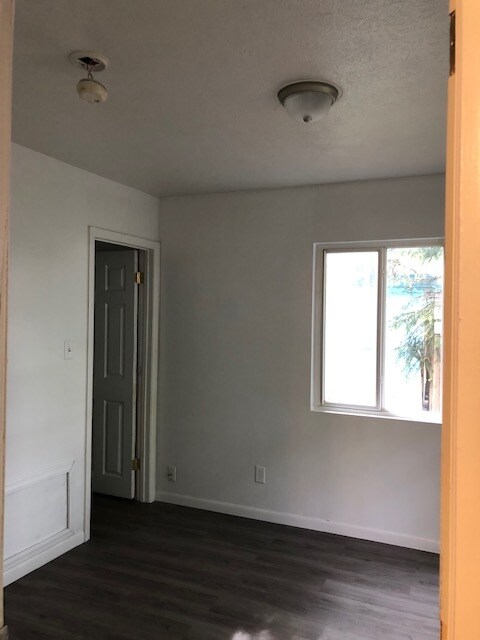
Spacious single level house with laundry on the main floor. Enclosed front porch, updated kitchen and bathroom plus a walk in closet. Great space to call home.
Tenant pays all utilities, landscaping and snow removal. 2 small pets with non-refundable pet fee of $300. One year lease including fridge and stove. No security deposit, non-refundable move in fee instead of $400. Lease breakage fee applies. Application fee is non-refundable. Showings are only scheduled with approved applicants.
Section 8 welcome.
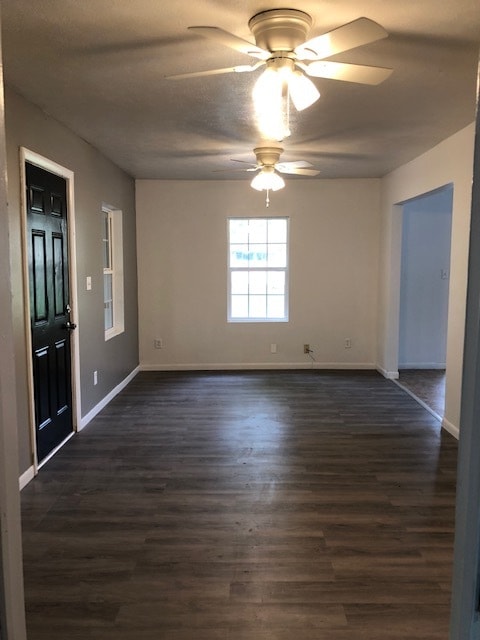
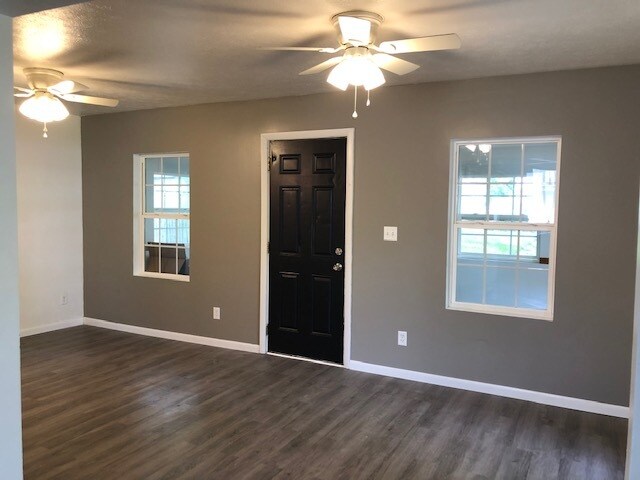
Spacious house with a large living room and open large kitchen, laundry room on main floor, enclosed front porch!
Listing Provided By

Map
Nearby Homes
- 1140 E Dayton St
- 1160 E Indiana Ave
- 2006 Leer St
- 1405 Randolph St
- 1402 E Calvert St
- 1613 Leer St
- 1602 Miami St
- 1600 Miami St
- 1133 E Donald St
- 1220 E Fox St
- 1530 Virginia St
- 1164 Lincoln Way E
- 1516 E Fox St
- 1801 Robinson St
- 1345 E Victoria St
- 2421 Miami St
- 809 E Ewing Ave
- 1201 S Twyckenham Dr
- 626 E Dubail Ave
- 913 E Victoria St
- 1801 Leer St
- 1131 E Bowman St
- 1343 E Bowman St
- 1912 Miami St
- 1912 Miami St
- 1210 Emerson Ave
- 1838 E Calvert St
- 1934 E Calvert St
- 809 S George Ave
- 1511 Carroll St
- 1106 S 20th St
- 226 E Fairview Ave
- 1310 Blossom Dr
- 126 Monmoor Ave
- 1010 S 26th St
- 1032 E Wayne St Unit 323 S. Eddy - 2nd floor apartment
- 519 Grand Blvd
- 521 Dale Ave
- 727 Dale Ave
- 2205 S William St