Estimated Value: $162,777 - $240,000
3
Beds
2
Baths
984
Sq Ft
$205/Sq Ft
Est. Value
About This Home
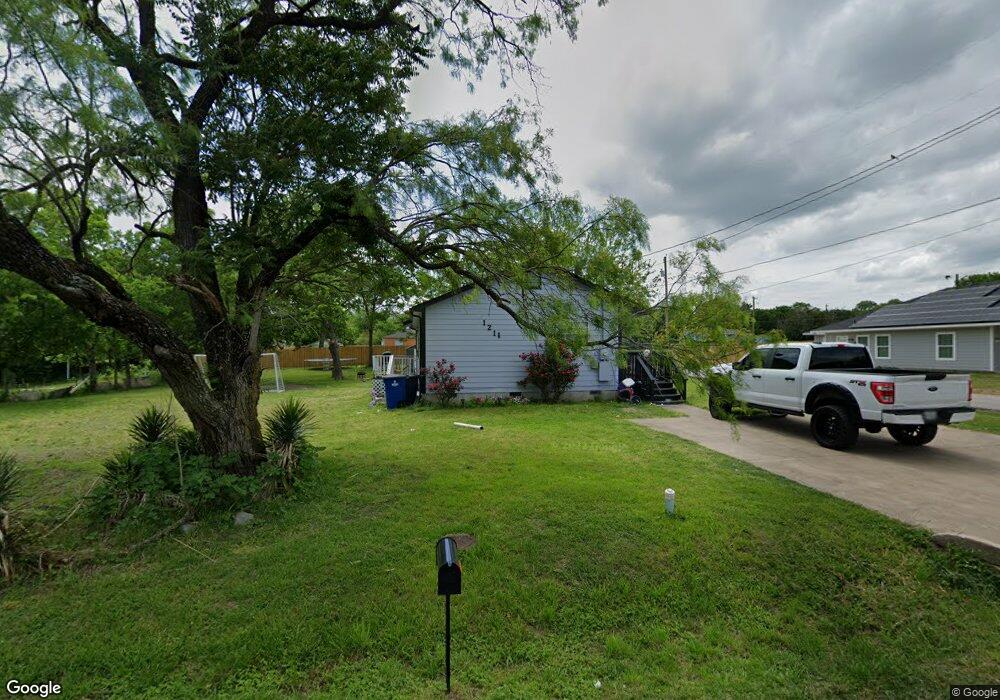
This home is located at 1211 Ripley St, Ennis, TX 75119 and is currently estimated at $201,389, approximately $204 per square foot. 1211 Ripley St is a home located in Ellis County with nearby schools including Austin Elementary School, Dorie Miller Int, and Ennis Junior High School.
Ownership History
Date
Name
Owned For
Owner Type
Purchase Details
Closed on
Mar 14, 2019
Sold by
Half Dome Llc
Bought by
Sanchez Karla Veronica Ventura
Current Estimated Value
Purchase Details
Closed on
May 2, 2016
Sold by
Lipset Investments Llc
Bought by
Ventura Karla V
Home Financials for this Owner
Home Financials are based on the most recent Mortgage that was taken out on this home.
Original Mortgage
$54,985
Interest Rate
3.87%
Mortgage Type
FHA
Purchase Details
Closed on
Dec 3, 2010
Sold by
Kirk Rex
Bought by
Lipset Investments Llc
Home Financials for this Owner
Home Financials are based on the most recent Mortgage that was taken out on this home.
Original Mortgage
$32,000
Interest Rate
4.24%
Mortgage Type
Purchase Money Mortgage
Purchase Details
Closed on
Feb 2, 2010
Sold by
Lister Jewel F
Bought by
Lipset Investments Llc and Kirk Rex
Purchase Details
Closed on
Oct 13, 2006
Sold by
Mccullar Lillian M
Bought by
Walter Mortgage Servicing Inc
Create a Home Valuation Report for This Property
The Home Valuation Report is an in-depth analysis detailing your home's value as well as a comparison with similar homes in the area
Home Values in the Area
Average Home Value in this Area
Purchase History
| Date | Buyer | Sale Price | Title Company |
|---|---|---|---|
| Sanchez Karla Veronica Ventura | -- | None Available | |
| Ventura Karla V | -- | Texas State Title | |
| Lipset Investments Llc | -- | -- | |
| Lipset Investments Llc | $30,500 | -- | |
| Walter Mortgage Servicing Inc | -- | None Available |
Source: Public Records
Mortgage History
| Date | Status | Borrower | Loan Amount |
|---|---|---|---|
| Previous Owner | Ventura Karla V | $54,985 | |
| Previous Owner | Lipset Investments Llc | $32,000 |
Source: Public Records
Tax History Compared to Growth
Tax History
| Year | Tax Paid | Tax Assessment Tax Assessment Total Assessment is a certain percentage of the fair market value that is determined by local assessors to be the total taxable value of land and additions on the property. | Land | Improvement |
|---|---|---|---|---|
| 2025 | $2,968 | $144,503 | $60,500 | $84,003 |
| 2024 | $2,968 | $137,836 | $49,500 | $88,336 |
| 2023 | $2,968 | $143,332 | $49,500 | $93,832 |
| 2022 | $2,244 | $93,768 | $27,000 | $66,768 |
| 2021 | $1,905 | $75,650 | $15,000 | $60,650 |
| 2020 | $2,032 | $78,980 | $15,000 | $63,980 |
| 2019 | $1,942 | $74,110 | $0 | $0 |
| 2018 | $1,806 | $68,920 | $9,500 | $59,420 |
| 2017 | $1,602 | $60,390 | $7,500 | $52,890 |
| 2016 | $1,384 | $52,170 | $6,000 | $46,170 |
| 2015 | $1,214 | $48,670 | $6,000 | $42,670 |
| 2014 | $1,214 | $45,840 | $0 | $0 |
Source: Public Records
Map
Nearby Homes
- 707 Washington St
- 510 Washington St
- 1308 Daffan Ave
- 1311 Daffan Ave
- 1408 N Johnson St
- 1206 N Kaufman St
- 206 Houston St
- 700 Loggins St
- 410 E Denton St
- 0 E Denton St Unit 20761063
- 1006 E Denton St
- 301 E Denton St
- 705 E Denton St
- 0000 E Decatur St
- 1106 N Mckinney St
- 206 E Belknap St
- 606 N Dallas St
- 607 N Dallas St
- 801 N Mckinney St
- 0000 Belknap St
- 1301 Ripley St
- 1205 Ripley St
- 511 Washington St
- 1212 Ripley St
- 601 Crisp Rd
- 1300 Ripley St
- 512 Washington St
- 1203 Ripley St
- 605 Crisp Rd
- 1206 Ripley St
- 1304 Ripley St
- 1204 Ripley St
- 1306 Ripley St
- 503 Washington St
- 1202 Ripley St
- 1211 Faulkner St
- 1301 Faulkner St
- 514 Washington St
- 604 Crisp Rd
- 1301 N Johnson St