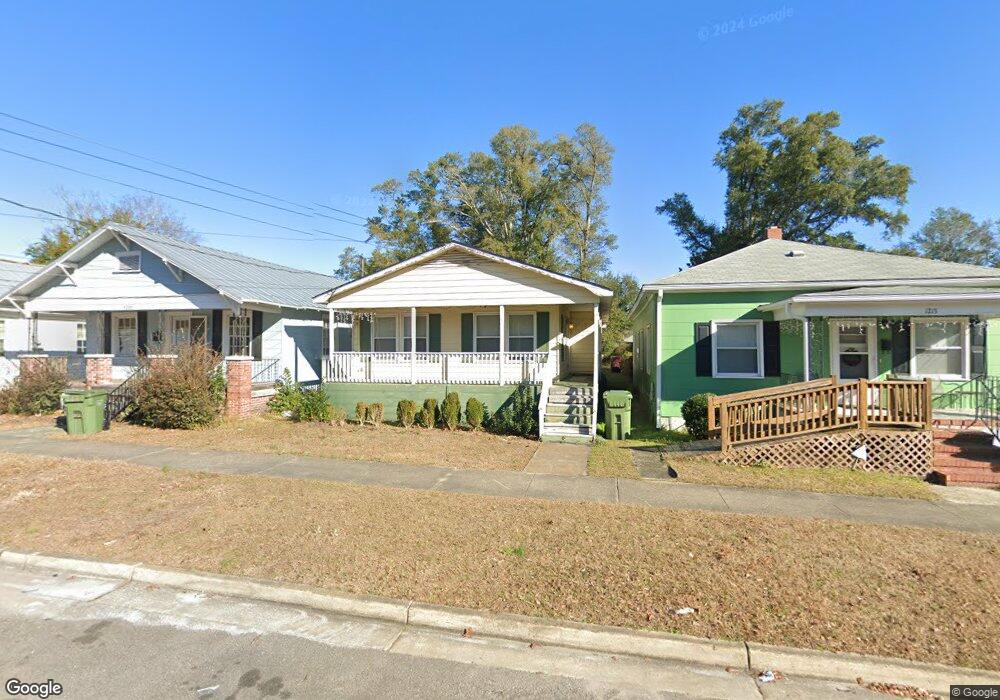
1211 S 8th St Wilmington, NC 28401
Dry Pond-South Side NeighborhoodEstimated Value: $170,000 - $261,000
2
Beds
2
Baths
968
Sq Ft
$232/Sq Ft
Est. Value
About This Home
This home is located at 1211 S 8th St, Wilmington, NC 28401 and is currently estimated at $225,052, approximately $232 per square foot. 1211 S 8th St is a home located in New Hanover County with nearby schools including Forest Hills Global Elementary School, Myrtle Grove Middle School, and John T. Hoggard High School.
Ownership History
Date
Name
Owned For
Owner Type
Purchase Details
Closed on
Nov 9, 2012
Sold by
Tate Wanda
Bought by
Moore Frank
Current Estimated Value
Purchase Details
Closed on
Oct 15, 2003
Sold by
Bank Of Ny Eqcc Trust 2001-2
Bought by
Moore Frank
Purchase Details
Closed on
Jun 17, 2003
Sold by
Hutchens H Terry Sub Trustee
Bought by
Bank Of Ny Eqcc Trust 2001-2
Purchase Details
Closed on
Jun 1, 1988
Sold by
Dickey Glenn Lee
Bought by
Lightfoot James H Darlene
Purchase Details
Closed on
Apr 10, 1974
Sold by
Grohman H G
Bought by
New Han Cnty/ Wilm City
Create a Home Valuation Report for This Property
The Home Valuation Report is an in-depth analysis detailing your home's value as well as a comparison with similar homes in the area
Home Values in the Area
Average Home Value in this Area
Purchase History
| Date | Buyer | Sale Price | Title Company |
|---|---|---|---|
| Moore Frank | -- | None Available | |
| Moore Frank | $15,500 | -- | |
| Bank Of Ny Eqcc Trust 2001-2 | $45,000 | -- | |
| Lightfoot James H Darlene | $1,000 | -- | |
| New Han Cnty/ Wilm City | -- | -- |
Source: Public Records
Tax History Compared to Growth
Tax History
| Year | Tax Paid | Tax Assessment Tax Assessment Total Assessment is a certain percentage of the fair market value that is determined by local assessors to be the total taxable value of land and additions on the property. | Land | Improvement |
|---|---|---|---|---|
| 2025 | $950 | $161,400 | $61,100 | $100,300 |
| 2024 | $1,110 | $150,600 | $38,200 | $112,400 |
| 2023 | $1,110 | $150,600 | $38,200 | $112,400 |
| 2022 | $1,280 | $150,600 | $38,200 | $112,400 |
| 2021 | $1,267 | $150,600 | $38,200 | $112,400 |
| 2020 | $658 | $62,500 | $17,900 | $44,600 |
| 2019 | $658 | $62,500 | $17,900 | $44,600 |
| 2018 | $658 | $62,500 | $17,900 | $44,600 |
| 2017 | $658 | $62,500 | $17,900 | $44,600 |
| 2016 | $803 | $72,500 | $20,100 | $52,400 |
| 2015 | $768 | $72,500 | $20,100 | $52,400 |
| 2014 | $735 | $72,500 | $20,100 | $52,400 |
Source: Public Records
Map
Nearby Homes