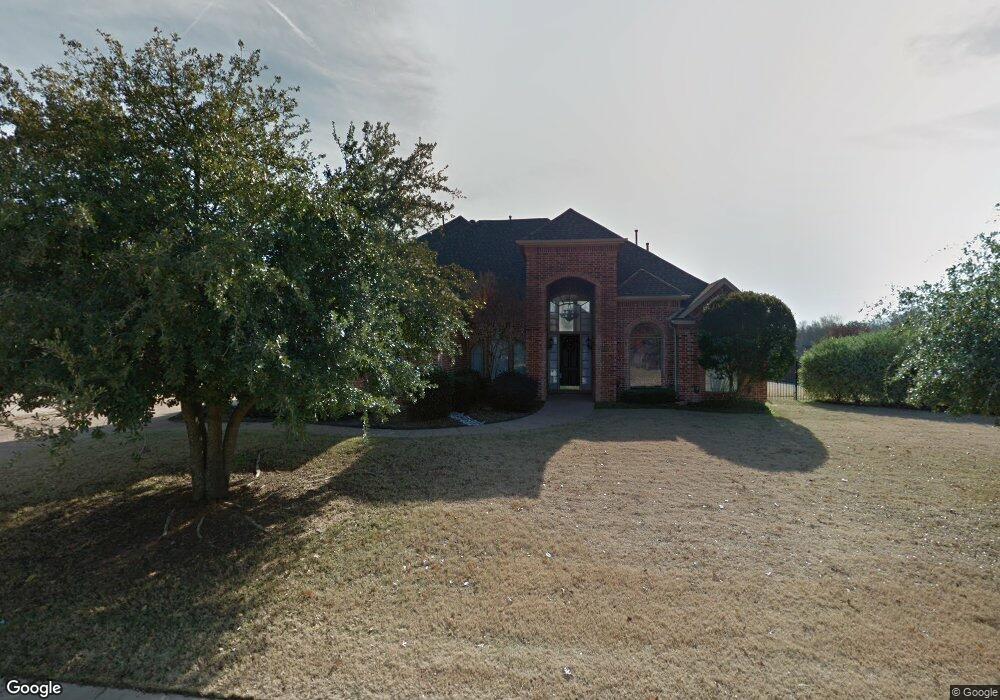
1211 Sarah Park Trail Southlake, TX 76092
Estimated Value: $1,187,000 - $1,445,000
4
Beds
4
Baths
4,826
Sq Ft
$270/Sq Ft
Est. Value
About This Home
This home is located at 1211 Sarah Park Trail, Southlake, TX 76092 and is currently estimated at $1,302,890, approximately $269 per square foot. 1211 Sarah Park Trail is a home located in Tarrant County with nearby schools including Old Union Elementary School, Eubanks Intermediate School, and George Dawson Middle School.
Ownership History
Date
Name
Owned For
Owner Type
Purchase Details
Closed on
Apr 30, 2014
Sold by
Moser Stephen B and Moser Katie A
Bought by
Tade Angie R and Tade Gavin D
Current Estimated Value
Home Financials for this Owner
Home Financials are based on the most recent Mortgage that was taken out on this home.
Original Mortgage
$360,000
Outstanding Balance
$264,177
Interest Rate
3.37%
Mortgage Type
Adjustable Rate Mortgage/ARM
Estimated Equity
$1,038,713
Purchase Details
Closed on
Sep 28, 2001
Sold by
Conn Anderson Homes Inc
Bought by
Moser Stephen B and Moser Katie A
Home Financials for this Owner
Home Financials are based on the most recent Mortgage that was taken out on this home.
Original Mortgage
$275,000
Interest Rate
6.84%
Purchase Details
Closed on
Jul 28, 2000
Sold by
Westerra Timarron Lp
Bought by
Conn Anderson Homes Inc
Create a Home Valuation Report for This Property
The Home Valuation Report is an in-depth analysis detailing your home's value as well as a comparison with similar homes in the area
Home Values in the Area
Average Home Value in this Area
Purchase History
| Date | Buyer | Sale Price | Title Company |
|---|---|---|---|
| Tade Angie R | -- | None Available | |
| Moser Stephen B | -- | Chicago Title | |
| Conn Anderson Homes Inc | -- | Stewart Title |
Source: Public Records
Mortgage History
| Date | Status | Borrower | Loan Amount |
|---|---|---|---|
| Open | Tade Angie R | $360,000 | |
| Previous Owner | Moser Stephen B | $275,000 |
Source: Public Records
Tax History Compared to Growth
Tax History
| Year | Tax Paid | Tax Assessment Tax Assessment Total Assessment is a certain percentage of the fair market value that is determined by local assessors to be the total taxable value of land and additions on the property. | Land | Improvement |
|---|---|---|---|---|
| 2025 | $18,665 | $883,700 | $236,250 | $647,450 |
| 2024 | $18,665 | $1,067,200 | $236,250 | $830,950 |
| 2023 | $21,557 | $1,182,700 | $236,250 | $946,450 |
| 2022 | $19,835 | $919,400 | $168,750 | $750,650 |
| 2021 | $17,848 | $782,803 | $168,750 | $614,053 |
| 2020 | $16,780 | $730,000 | $168,750 | $561,250 |
| 2019 | $17,677 | $730,000 | $168,750 | $561,250 |
| 2018 | $16,829 | $695,000 | $168,750 | $526,250 |
| 2017 | $16,731 | $675,000 | $168,750 | $506,250 |
| 2016 | $15,801 | $637,479 | $168,750 | $468,729 |
| 2015 | $14,376 | $593,600 | $74,250 | $519,350 |
| 2014 | $14,376 | $593,600 | $74,250 | $519,350 |
Source: Public Records
Map
Nearby Homes
- 710 Longford Dr
- 1100 La Paloma Ct
- 1012 Cool River Dr
- 708 Nettleton Dr
- 1401 Chardonnay Ct
- 712 Ashleigh Ln
- 1420 Kensington Ct
- 1227 Strathmore Dr
- 608 Regency Crossing
- 702 Sussex Ct
- 521 Regency Crossing
- 1719 Byron Nelson Pkwy
- 1304 Kings Brook Ct
- 223 Westwood Dr
- 1206 Timberline Ct
- 1032 Rosavine Dr
- 1028 Rosavine Dr
- 1017 Rosavine Dr
- 1004 Rosavine Dr
- 1020 Rosavine Dr
- 1209 Sarah Park Trail
- 1220 Sarah Park Trail
- 1218 Sarah Park Trail
- 1210 Sarah Park Trail
- 1207 Sarah Park Trail
- 1212 Sarah Park Trail
- 1245 Haven Cir
- 1208 Sarah Park Trail
- 1250 Haven Cir
- 1105 Haven Cir
- 1214 Sarah Park Trail
- 1206 Sarah Park Trail
- 901 Jenny Terrace
- 1240 Haven Cir
- 1235 Haven Cir
- 801 Longford Dr
- 803 Longford Dr
- 1115 Haven Cir
- 735 Longford Dr
- 805 Longford Dr