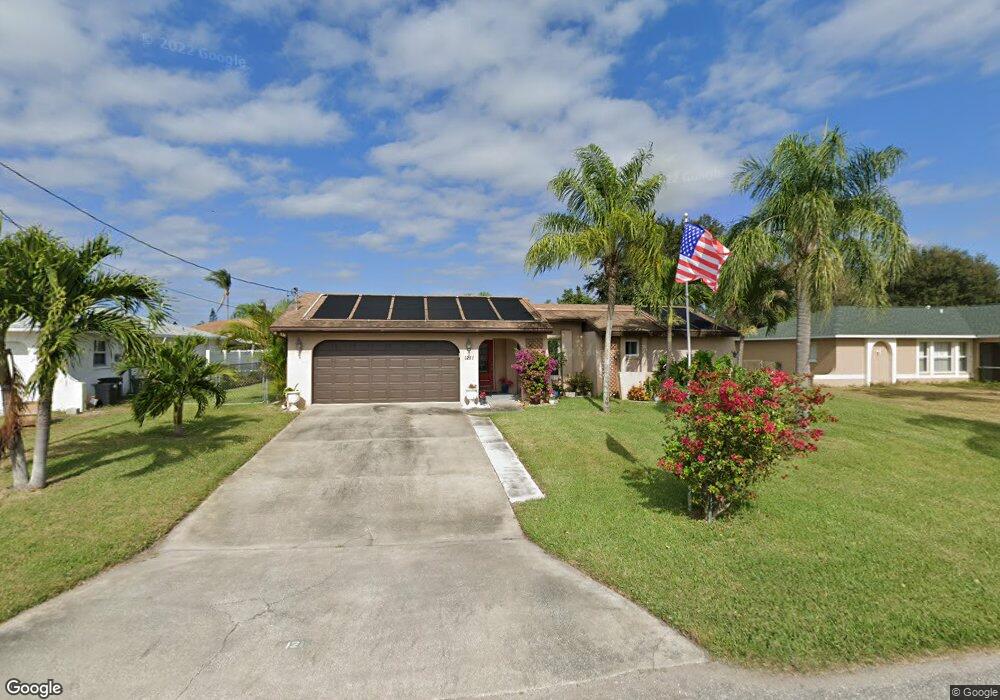
1211 SE 19th Ln Cape Coral, FL 33990
Hancock NeighborhoodEstimated Value: $248,000 - $292,000
2
Beds
2
Baths
2,012
Sq Ft
$137/Sq Ft
Est. Value
About This Home
This home is located at 1211 SE 19th Ln, Cape Coral, FL 33990 and is currently estimated at $275,816, approximately $137 per square foot. 1211 SE 19th Ln is a home located in Lee County with nearby schools including Caloosa Elementary School, Cape Elementary School, and Tropic Isles Elementary School.
Ownership History
Date
Name
Owned For
Owner Type
Purchase Details
Closed on
May 2, 2012
Sold by
Janisch Richard B and Janisch Judith A
Bought by
Janisch Richard B and Janisch Judith A
Current Estimated Value
Purchase Details
Closed on
Jun 3, 2008
Sold by
Yale Mortgage Corp
Bought by
Janisch Richard B and Janisch Judith A
Purchase Details
Closed on
Apr 14, 2008
Sold by
Crotty Joseph S and Crotty Deborah
Bought by
Yale Mortgage Corp
Purchase Details
Closed on
Nov 22, 2000
Sold by
Johnston George
Bought by
Crotty Joseph S and Crotty Deborah
Home Financials for this Owner
Home Financials are based on the most recent Mortgage that was taken out on this home.
Original Mortgage
$61,500
Interest Rate
7.71%
Purchase Details
Closed on
May 15, 1997
Sold by
Fortunato Nellie
Bought by
Elk Christopher Red
Home Financials for this Owner
Home Financials are based on the most recent Mortgage that was taken out on this home.
Original Mortgage
$51,000
Interest Rate
8.2%
Mortgage Type
FHA
Create a Home Valuation Report for This Property
The Home Valuation Report is an in-depth analysis detailing your home's value as well as a comparison with similar homes in the area
Home Values in the Area
Average Home Value in this Area
Purchase History
| Date | Buyer | Sale Price | Title Company |
|---|---|---|---|
| Janisch Richard B | -- | None Available | |
| Janisch Richard B | $98,500 | Best Title Solutions Inc | |
| Yale Mortgage Corp | $4,000 | Attorney | |
| Crotty Joseph S | $69,000 | -- | |
| Elk Christopher Red | $57,700 | -- |
Source: Public Records
Mortgage History
| Date | Status | Borrower | Loan Amount |
|---|---|---|---|
| Previous Owner | Crotty Joseph S | $61,500 | |
| Previous Owner | Elk Christopher Red | $51,000 |
Source: Public Records
Tax History Compared to Growth
Tax History
| Year | Tax Paid | Tax Assessment Tax Assessment Total Assessment is a certain percentage of the fair market value that is determined by local assessors to be the total taxable value of land and additions on the property. | Land | Improvement |
|---|---|---|---|---|
| 2025 | $1,801 | $103,596 | -- | -- |
| 2024 | $1,677 | $100,676 | -- | -- |
| 2023 | $1,677 | $97,744 | $0 | $0 |
| 2022 | $1,501 | $94,897 | $0 | $0 |
| 2021 | $1,447 | $151,151 | $32,292 | $118,859 |
| 2020 | $1,440 | $90,861 | $0 | $0 |
| 2019 | $1,382 | $88,818 | $0 | $0 |
| 2018 | $1,360 | $87,162 | $0 | $0 |
| 2017 | $1,317 | $85,369 | $0 | $0 |
| 2016 | $1,276 | $113,732 | $17,590 | $96,142 |
| 2015 | $1,256 | $98,307 | $14,508 | $83,799 |
| 2014 | -- | $105,701 | $11,836 | $93,865 |
| 2013 | -- | $91,896 | $11,294 | $80,602 |
Source: Public Records
Map
Nearby Homes
- 1220 SE 19th Ln
- 1122 SE 19th St
- 1222 SE 18th Terrace
- 1202 SE 21st St
- 1411 SE 18th Terrace
- 1114 SE 21st Terrace
- 1321 SE 21st Ln
- 1927 SE 10th Place
- 147 SE 21st Ln
- 1922 SE 10th Place
- 1507 SE 21st St
- 2114 SE 11th Place
- 1910 SE 10th Place
- 1406 SE 22nd St
- 1103 SE 18th St
- 1439 SE 18th St
- 1902 SE 15th Place
- 1516 SE 20th St
- 1927 SE 10th Ave
- 1725 SE 10th Place
- 1215 SE 19th Ln
- 1209 SE 19th Ln
- 1212 SE 19th Terrace
- 1208 SE 19th Terrace
- 1219 SE 19th Ln
- 1203 SE 19th Ln Unit 21
- 1212 SE 19th Ln
- 1208 SE 19th Ln
- 1216 SE 19th Ln
- 1220 SE 19th Terrace
- 1204 SE 19th Terrace
- 1204 SE 19th Ln
- 1223 SE 19th Ln
- 1302 SE 19th Terrace
- 1146 SE 19th Ln
- 1211 SE 19th Terrace
- 1143 SE 19th Ln
- 1215 SE 20th St Unit 33
- 1215 SE 20th St
- 1211 SE 20th St