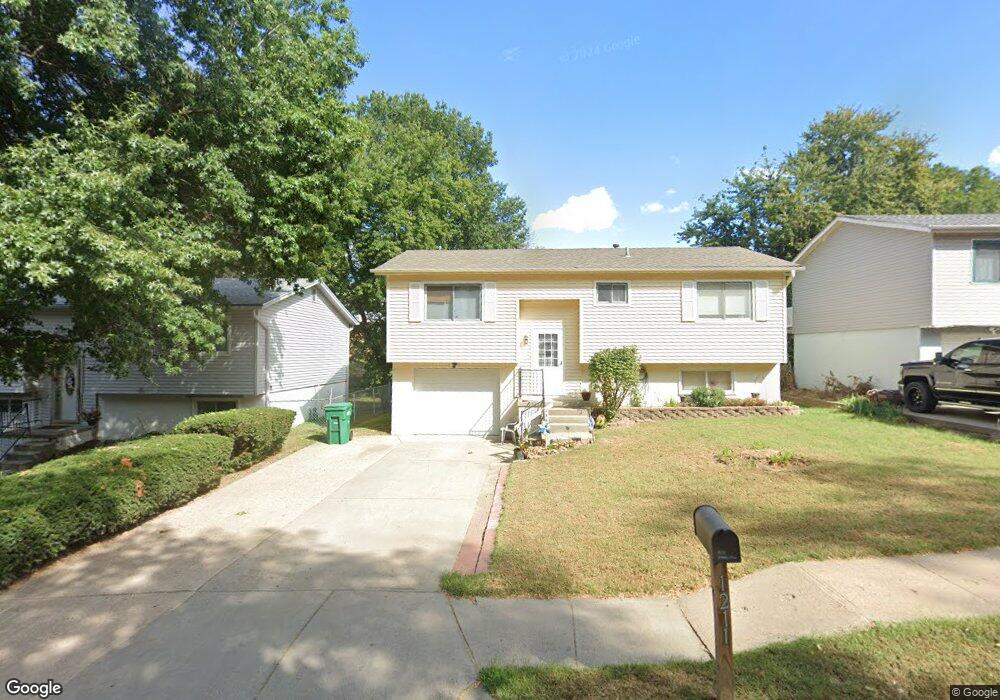
1211 St Plattsmouth, NE 68048
Estimated Value: $213,613 - $237,000
3
Beds
3
Baths
1,224
Sq Ft
$185/Sq Ft
Est. Value
About This Home
This home is located at 1211 St, Plattsmouth, NE 68048 and is currently estimated at $225,903, approximately $184 per square foot. 1211 St is a home located in Cass County with nearby schools including Plattsmouth Elementary School, Plattsmouth Middle School, and Plattsmouth High School.
Ownership History
Date
Name
Owned For
Owner Type
Purchase Details
Closed on
Dec 30, 2020
Sold by
Morris Kim and Pierce Lyle
Bought by
Pierce Marcus and Pierce Chloe
Current Estimated Value
Purchase Details
Closed on
Jul 31, 2006
Sold by
Harper Dennis K and Harper Denise K
Bought by
Pierce Lyle
Home Financials for this Owner
Home Financials are based on the most recent Mortgage that was taken out on this home.
Original Mortgage
$90,800
Interest Rate
6.77%
Mortgage Type
Purchase Money Mortgage
Create a Home Valuation Report for This Property
The Home Valuation Report is an in-depth analysis detailing your home's value as well as a comparison with similar homes in the area
Home Values in the Area
Average Home Value in this Area
Purchase History
| Date | Buyer | Sale Price | Title Company |
|---|---|---|---|
| Pierce Marcus | -- | None Available | |
| Pierce Lyle | $90,000 | -- |
Source: Public Records
Mortgage History
| Date | Status | Borrower | Loan Amount |
|---|---|---|---|
| Previous Owner | Pierce Lyle | $90,800 |
Source: Public Records
Tax History Compared to Growth
Tax History
| Year | Tax Paid | Tax Assessment Tax Assessment Total Assessment is a certain percentage of the fair market value that is determined by local assessors to be the total taxable value of land and additions on the property. | Land | Improvement |
|---|---|---|---|---|
| 2024 | $2,362 | $139,765 | $20,900 | $118,865 |
| 2023 | $2,697 | $131,354 | $18,149 | $113,205 |
| 2022 | $2,571 | $129,432 | $19,056 | $110,376 |
| 2021 | $2,329 | $113,309 | $13,444 | $99,865 |
| 2020 | $2,234 | $103,209 | $13,444 | $89,765 |
| 2019 | $2,207 | $103,209 | $13,444 | $89,765 |
| 2018 | $1,984 | $89,278 | $13,444 | $75,834 |
| 2017 | $1,981 | $89,278 | $13,444 | $75,834 |
| 2016 | $1,946 | $89,278 | $13,444 | $75,834 |
| 2015 | $1,928 | $89,278 | $13,444 | $75,834 |
| 2014 | $2,025 | $89,278 | $13,444 | $75,834 |
Source: Public Records
Map
Nearby Homes