Estimated Value: $757,000 - $824,000
4
Beds
4
Baths
1,910
Sq Ft
$412/Sq Ft
Est. Value
About This Home
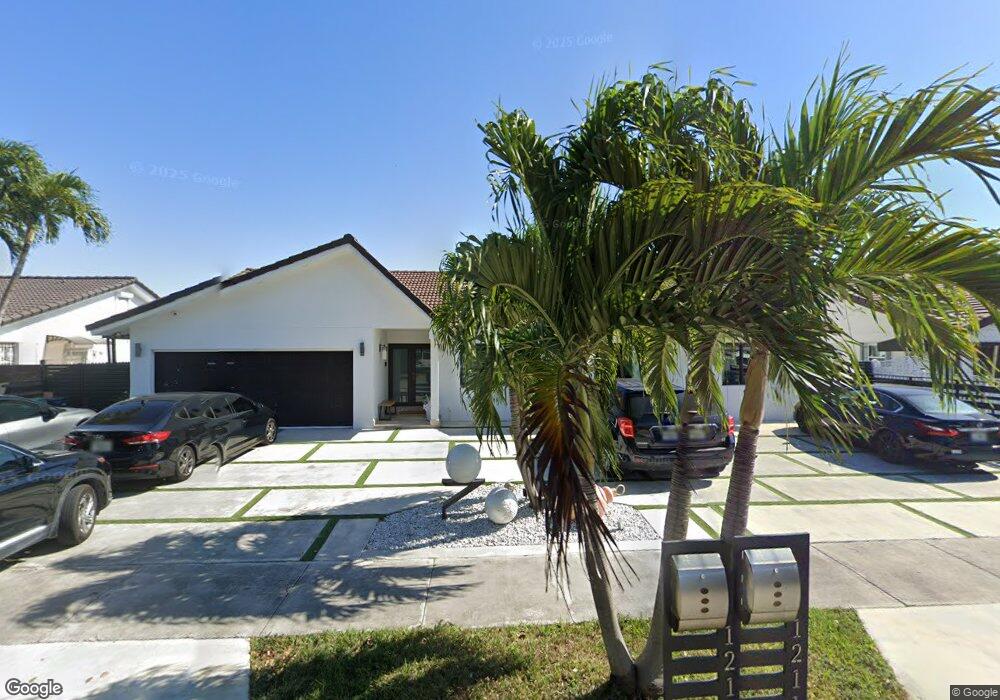
This home is located at 1211 SW 139th Ave, Miami, FL 33184 and is currently estimated at $786,601, approximately $411 per square foot. 1211 SW 139th Ave is a home located in Miami-Dade County with nearby schools including Joe Hall Elementary School, W. R. Thomas Middle School, and G. Holmes Braddock Senior High School.
Ownership History
Date
Name
Owned For
Owner Type
Purchase Details
Closed on
Sep 4, 2018
Sold by
Gonzalez Azany Ortiz
Bought by
Torre Alexis Perez De La and Penate Mayelin Casabona
Current Estimated Value
Home Financials for this Owner
Home Financials are based on the most recent Mortgage that was taken out on this home.
Original Mortgage
$300,000
Outstanding Balance
$261,079
Interest Rate
4.5%
Mortgage Type
New Conventional
Estimated Equity
$525,522
Purchase Details
Closed on
Jun 19, 2015
Sold by
Ortiz Juan
Bought by
Ortiz Gonzalez Azani
Purchase Details
Closed on
May 14, 2015
Sold by
J & C Investor Corp
Bought by
Ortiz Juan
Purchase Details
Closed on
Aug 6, 2012
Sold by
Perez Llopiz Aleida and Perez Aleida
Bought by
J & C Investors Corporation
Purchase Details
Closed on
Mar 4, 2000
Sold by
Maurice and Cayon Rosa M
Bought by
Perez-Llopiz Aleida
Create a Home Valuation Report for This Property
The Home Valuation Report is an in-depth analysis detailing your home's value as well as a comparison with similar homes in the area
Home Values in the Area
Average Home Value in this Area
Purchase History
| Date | Buyer | Sale Price | Title Company |
|---|---|---|---|
| Torre Alexis Perez De La | $400,000 | Nu World Title Llc | |
| Ortiz Gonzalez Azani | -- | Attorney | |
| Ortiz Juan | -- | None Available | |
| J & C Investors Corporation | $220,000 | My Home Title Services Inc | |
| Perez-Llopiz Aleida | $155,000 | -- |
Source: Public Records
Mortgage History
| Date | Status | Borrower | Loan Amount |
|---|---|---|---|
| Open | Torre Alexis Perez De La | $300,000 | |
| Previous Owner | Perez-Llopiz Aleida | $630,000 | |
| Previous Owner | Perez-Llopiz Aleida | $45,001 |
Source: Public Records
Tax History Compared to Growth
Tax History
| Year | Tax Paid | Tax Assessment Tax Assessment Total Assessment is a certain percentage of the fair market value that is determined by local assessors to be the total taxable value of land and additions on the property. | Land | Improvement |
|---|---|---|---|---|
| 2025 | $7,136 | $432,334 | -- | -- |
| 2024 | $6,818 | $420,150 | -- | -- |
| 2023 | $6,818 | $407,913 | $0 | $0 |
| 2022 | $6,571 | $396,033 | $0 | $0 |
| 2021 | $6,548 | $384,499 | $0 | $0 |
| 2020 | $6,475 | $379,191 | $173,098 | $206,093 |
| 2019 | $6,543 | $342,217 | $165,572 | $176,645 |
| 2018 | $0 | $345,826 | $167,830 | $177,996 |
| 2017 | $5,798 | $304,632 | $0 | $0 |
| 2016 | $5,563 | $286,395 | $0 | $0 |
| 2015 | $5,338 | $268,322 | $0 | $0 |
| 2014 | $5,040 | $244,245 | $0 | $0 |
Source: Public Records
Map
Nearby Homes
- 1112 SW 138th Place
- 1311 SW 139th Ct
- 13851 SW 14th St
- 1291 SW 139th Place
- 13736 SW 12th St
- 13926 SW 14th St
- 1521 SW 138th Ave
- 13723 SW 15th St
- 13930 SW 16th Terrace
- 13841 SW 17th Terrace
- 881 SW 137th Ct
- 14199 SW 9th St
- 1385 SW 143rd Ct
- 1456 SW 134th Place
- 996 SW 143rd Ct
- 14240 SW 19th Terrace
- 13331 SW 17th Ln Unit 42
- 14352 SW 18th St
- 13261 SW 17th Ln Unit 26-5
- 13251 SW 17th Ln Unit 22-1
- 1201 SW 139th Ave
- 1234 SW 138th Place
- 1233 SW 138th Place
- 1224 SW 138th Place
- 1244 SW 138th Place
- 1214 SW 138th Place
- 1254 SW 138th Place
- 1240 SW 139th Ave
- 1220 SW 139th Ave
- 1260 SW 139th Ave
- 1264 SW 138th Place
- 1200 SW 139th Ave
- 1271 SW 138th Ct
- 1280 SW 139th Ave
- 1135 SW 139th Ave
- 1152 SW 138th Place
- 1243 SW 138th Place
- 1223 SW 138th Place
- 1302 SW 138th Place