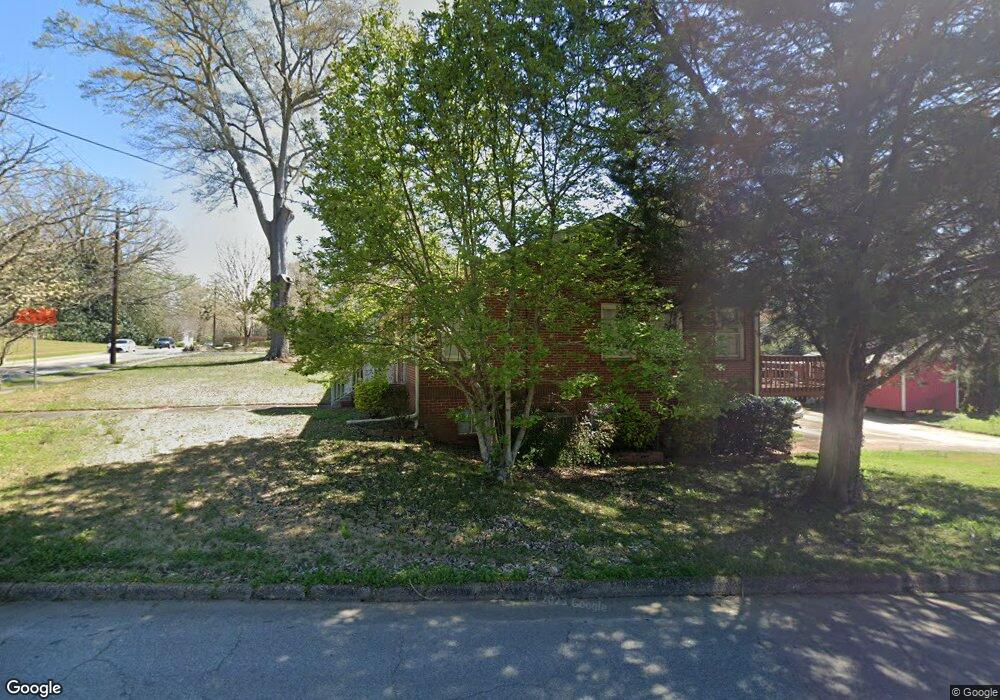
1211 Vernon St Lagrange, GA 30240
Estimated Value: $255,000 - $284,000
About This Home
This home is located at 1211 Vernon St, Lagrange, GA 30240 and is currently estimated at $262,610, approximately $148 per square foot. 1211 Vernon St is a home located in Troup County with nearby schools including Ethel W. Kight Elementary School, Hollis Hand Elementary School, and Franklin Forest Elementary School.
Ownership History
We collect this data history from publicly available records. To have your information removed, we recommend requesting removal directly through your county’s website.
Purchase Details
Purchase Details
Home Financials for this Owner
Home Financials are based on the most recent Mortgage that was taken out on this home.Purchase Details
Purchase Details
Purchase Details
Purchase Details
Purchase Details
Purchase Details
Purchase History
We collect this data history from publicly available records. To have your information removed, we recommend requesting removal directly through your county’s website.
| Date | Buyer | Sale Price | Title Company |
|---|---|---|---|
| -- | -- | ||
| -- | -- | ||
| $148,000 | -- | ||
| $113,000 | -- | ||
| $100,000 | -- | ||
| -- | -- | ||
| -- | -- | ||
| -- | -- | ||
| -- | -- |
Mortgage History
We collect this data history from publicly available records. To have your information removed, we recommend requesting removal directly through your county’s website.
| Date | Status | Borrower | Loan Amount |
|---|---|---|---|
| Previous Owner | $118,400 |
Tax History
We collect this data history from publicly available records. To have your information removed, we recommend requesting removal directly through your county’s website.
| Year | Tax Paid | Tax Assessment Tax Assessment Total Assessment is a certain percentage of the fair market value that is determined by local assessors to be the total taxable value of land and additions on the property. | Land | Improvement |
|---|---|---|---|---|
| 2025 | $2,408 | $94,560 | $8,120 | $86,440 |
| 2024 | $2,195 | $82,480 | $8,120 | $74,360 |
| 2023 | $1,239 | $65,320 | $8,120 | $57,200 |
| 2022 | $1,664 | $61,600 | $8,120 | $53,480 |
| 2021 | $1,169 | $40,760 | $8,120 | $32,640 |
| 2020 | $1,169 | $40,760 | $8,120 | $32,640 |
| 2019 | $1,084 | $37,940 | $8,180 | $29,760 |
| 2018 | $1,084 | $37,940 | $8,180 | $29,760 |
| 2017 | $1,084 | $37,940 | $8,180 | $29,760 |
| 2016 | $1,053 | $36,912 | $8,180 | $28,732 |
| 2015 | $987 | $34,634 | $8,132 | $26,502 |
| 2014 | $946 | $33,239 | $8,132 | $25,107 |
| 2013 | -- | $33,230 | $8,176 | $25,054 |
Map
- 0 N Lee St Unit 10550825
- 217 Jefferson St
- 310 N Lee St
- 412 S Lee St
- 211 Moores Hill
- 0 Moores Hill
- 138 Martha St
- 517 Jefferson St
- 208 Boulevard
- 304 Boulevard
- 519 Freeman St
- 113 Oakview Ln
- 202 Parker Ln
- 613 S Lee St
- 600 Park Ave
- 601 Cherokee Rd
- 109 Garfield St
- 408 Harwell Ave
- 207 Wilkes St
- 0 Hills and Dales Farm Rd
- 1205 Vernon St
- 201 N Lee St
- 203 N Lee St
- 0 Vernon St Unit 10505055
- 0 Vernon St Unit 7124290
- 1201 Vernon St
- 1201 Vernon St Unit 1 & 2
- 1301 Vernon St
- 202 Jefferson St
- 207 N Lee St
- 1305 Vernon St Unit B
- 1305 Vernon St Unit A
- 1305 Vernon St
- 1305 A & B Vernon St
- 206 Jefferson St
- 202 N Lee St
- 208 Jefferson St
- 209 N Lee St
- 1109 Vernon St
- 1307 Vernon St
Ask me questions while you tour the home.