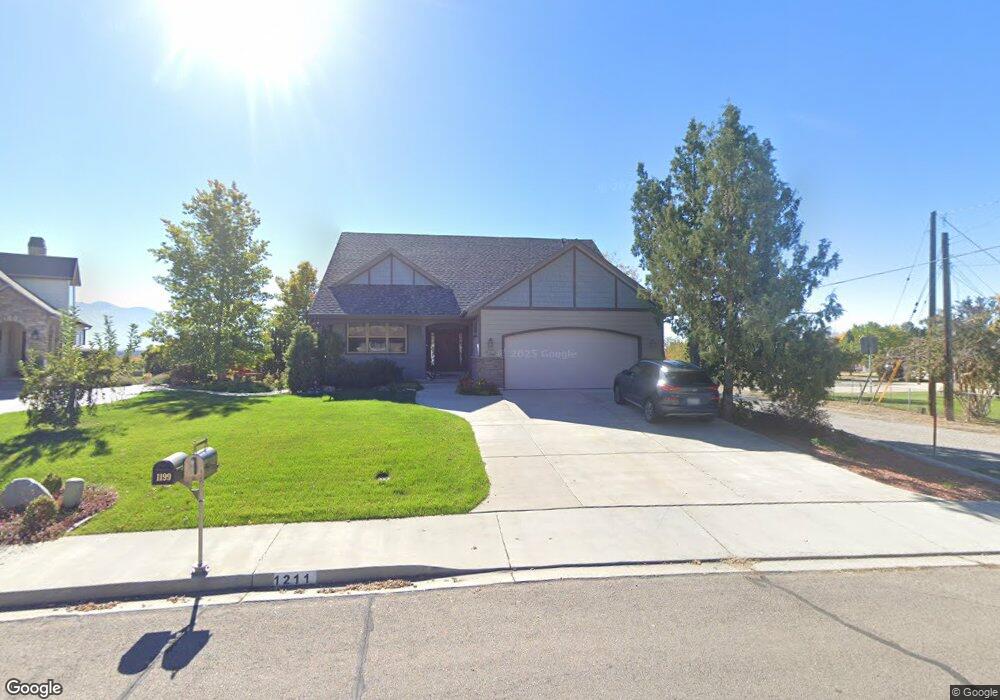
1211 W 1050 N Provo, UT 84604
Grandview South NeighborhoodEstimated Value: $532,000 - $763,000
1
Bed
3
Baths
1,678
Sq Ft
$394/Sq Ft
Est. Value
About This Home
This home is located at 1211 W 1050 N, Provo, UT 84604 and is currently estimated at $661,635, approximately $394 per square foot. 1211 W 1050 N is a home located in Utah County with nearby schools including Westridge Elementary School, Dixon Middle School, and Provo High School.
Ownership History
Date
Name
Owned For
Owner Type
Purchase Details
Closed on
Oct 13, 2023
Sold by
Robison Jeffrey C and Robison Crystal S
Bought by
Rt1211 Llc
Current Estimated Value
Purchase Details
Closed on
Apr 17, 1998
Sold by
Larsen Mark F and Larsen Lisa Gray
Bought by
Robison Jeffrey C and Robison Crystal S
Home Financials for this Owner
Home Financials are based on the most recent Mortgage that was taken out on this home.
Original Mortgage
$90,300
Interest Rate
7.18%
Create a Home Valuation Report for This Property
The Home Valuation Report is an in-depth analysis detailing your home's value as well as a comparison with similar homes in the area
Home Values in the Area
Average Home Value in this Area
Purchase History
| Date | Buyer | Sale Price | Title Company |
|---|---|---|---|
| Rt1211 Llc | -- | None Listed On Document | |
| Robison Jeffrey C | -- | -- |
Source: Public Records
Mortgage History
| Date | Status | Borrower | Loan Amount |
|---|---|---|---|
| Previous Owner | Robison Jeffrey C | $90,300 |
Source: Public Records
Tax History Compared to Growth
Tax History
| Year | Tax Paid | Tax Assessment Tax Assessment Total Assessment is a certain percentage of the fair market value that is determined by local assessors to be the total taxable value of land and additions on the property. | Land | Improvement |
|---|---|---|---|---|
| 2025 | $3,222 | $360,360 | $186,000 | $469,200 |
| 2024 | $3,222 | $317,130 | $0 | $0 |
| 2023 | $3,293 | $319,550 | $0 | $0 |
| 2022 | $3,405 | $333,190 | $0 | $0 |
| 2021 | $2,662 | $454,300 | $118,000 | $336,300 |
| 2020 | $2,565 | $410,300 | $107,300 | $303,000 |
| 2019 | $2,455 | $408,400 | $107,300 | $301,100 |
| 2018 | $2,339 | $394,700 | $99,600 | $295,100 |
| 2017 | $2,251 | $208,670 | $0 | $0 |
| 2016 | $2,314 | $199,980 | $0 | $0 |
| 2015 | $2,142 | $187,110 | $0 | $0 |
| 2014 | $1,758 | $160,050 | $0 | $0 |
Source: Public Records
Map
Nearby Homes