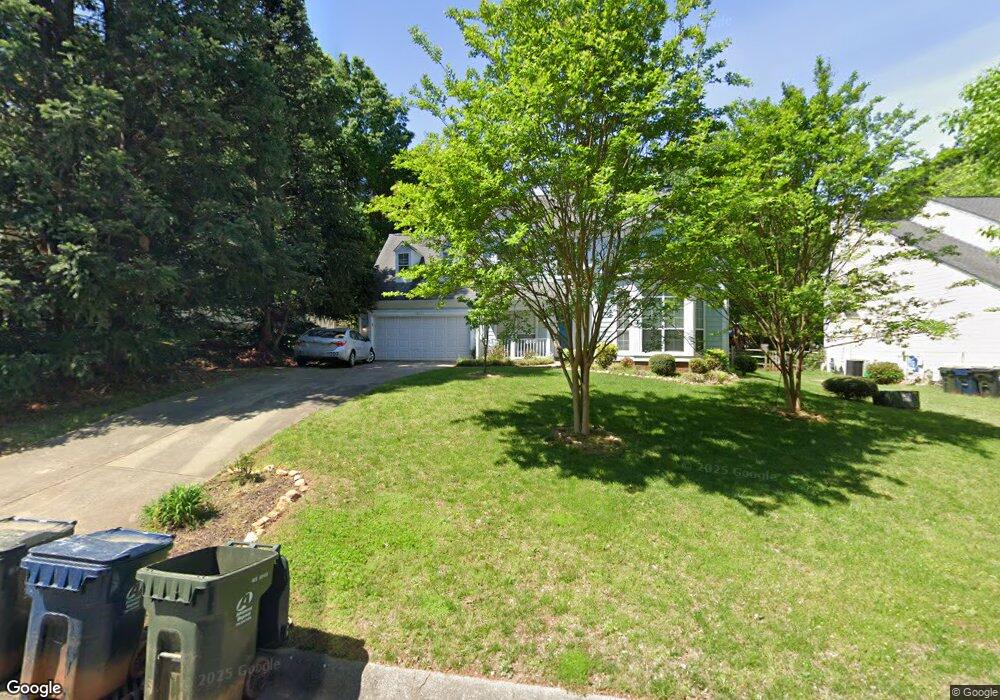
12111 Moonshadow Ln Huntersville, NC 28078
Estimated Value: $461,000 - $489,000
4
Beds
3
Baths
2,349
Sq Ft
$202/Sq Ft
Est. Value
About This Home
This home is located at 12111 Moonshadow Ln, Huntersville, NC 28078 and is currently estimated at $473,805, approximately $201 per square foot. 12111 Moonshadow Ln is a home located in Mecklenburg County with nearby schools including Torrence Creek Elementary School, Francis Bradley Middle School, and Hopewell High.
Ownership History
Date
Name
Owned For
Owner Type
Purchase Details
Closed on
May 6, 2024
Sold by
Young Kimberly J and Young Jeffrey N
Bought by
Young Family Living Trust and Young
Current Estimated Value
Purchase Details
Closed on
Apr 15, 2016
Sold by
Young Lynn
Bought by
Young Jeffrey Neil
Purchase Details
Closed on
Sep 30, 2002
Sold by
Stone Sam B and Stone Aniko V
Bought by
Young Jeffrey Neil and Young Lynn
Home Financials for this Owner
Home Financials are based on the most recent Mortgage that was taken out on this home.
Original Mortgage
$110,000
Interest Rate
6.19%
Mortgage Type
Purchase Money Mortgage
Purchase Details
Closed on
Dec 6, 2000
Sold by
Eichorn Richard H and Eichorn Jonna R
Bought by
Stone Sam B and Stone Aniko
Home Financials for this Owner
Home Financials are based on the most recent Mortgage that was taken out on this home.
Original Mortgage
$161,990
Interest Rate
7.71%
Mortgage Type
Purchase Money Mortgage
Create a Home Valuation Report for This Property
The Home Valuation Report is an in-depth analysis detailing your home's value as well as a comparison with similar homes in the area
Home Values in the Area
Average Home Value in this Area
Purchase History
| Date | Buyer | Sale Price | Title Company |
|---|---|---|---|
| Young Family Living Trust | -- | None Listed On Document | |
| Young Jeffrey Neil | -- | None Available | |
| Young Jeffrey Neil | $172,500 | -- | |
| Stone Sam B | $167,000 | -- |
Source: Public Records
Mortgage History
| Date | Status | Borrower | Loan Amount |
|---|---|---|---|
| Previous Owner | Young Jeffrey Neil | $110,000 | |
| Previous Owner | Stone Sam B | $161,990 |
Source: Public Records
Tax History Compared to Growth
Tax History
| Year | Tax Paid | Tax Assessment Tax Assessment Total Assessment is a certain percentage of the fair market value that is determined by local assessors to be the total taxable value of land and additions on the property. | Land | Improvement |
|---|---|---|---|---|
| 2025 | $2,963 | $388,400 | $100,000 | $288,400 |
| 2024 | $2,963 | $388,400 | $100,000 | $288,400 |
| 2023 | $2,720 | $388,400 | $100,000 | $288,400 |
| 2022 | $2,348 | $254,700 | $70,000 | $184,700 |
| 2021 | $2,331 | $254,700 | $70,000 | $184,700 |
| 2020 | $2,306 | $254,700 | $70,000 | $184,700 |
| 2019 | $2,300 | $254,700 | $70,000 | $184,700 |
| 2018 | $2,397 | $202,600 | $50,000 | $152,600 |
| 2017 | $2,367 | $202,600 | $50,000 | $152,600 |
| 2016 | $2,363 | $202,600 | $50,000 | $152,600 |
| 2015 | $2,360 | $202,600 | $50,000 | $152,600 |
| 2014 | $2,358 | $0 | $0 | $0 |
Source: Public Records
Map
Nearby Homes
- 12610 Angel Oak Dr
- 00 Stratton Farm Rd
- 9003 Maple Hill Ct
- 12415 Bluff Meadow Trail
- 9121 Pine Springs Ct
- 11809 Mccoy Rd
- 7900 Rolling Meadows Ln
- 7621 Rolling Meadows Ln
- 12904 Windy Lea Ln
- 12451 Journeys End Trail
- 13016 Meadowmere Rd
- 9616 Mendenhall View Dr
- 12323 Cross Meadow Rd
- 52.55 acres McIlwaine Rd
- 8351 Rolling Meadows Ln
- 12450 Stone Garden Dr
- 9208 Detroiter Dr
- 12426 Stone Garden Dr
- 12216 Mascot Ln
- 7826 Leisure Ln
- 12119 Moonshadow Ln
- 12103 Moonshadow Ln
- 12025 Moonshadow Ln
- 12127 Moonshadow Ln
- 12731 Hollyhock Ln
- 8507 Lyman Oak Ct
- 12019 Moonshadow Ln
- 12133 Moonshadow Ln
- 12727 Hollyhock Ln
- 12727 Hollyhock Ln Unit 44
- 8513 Lyman Oak Ct
- 8504 Lyman Oak Ct
- 12013 Moonshadow Ln
- 12732 Hollyhock Ln
- 12137 Moonshadow Ln
- 12721 Hollyhock Ln
- 8510 Lyman Oak Ct
- 12726 Hollyhock Ln
- 12007 Moonshadow Ln
- 8515 Lyman Oak Ct