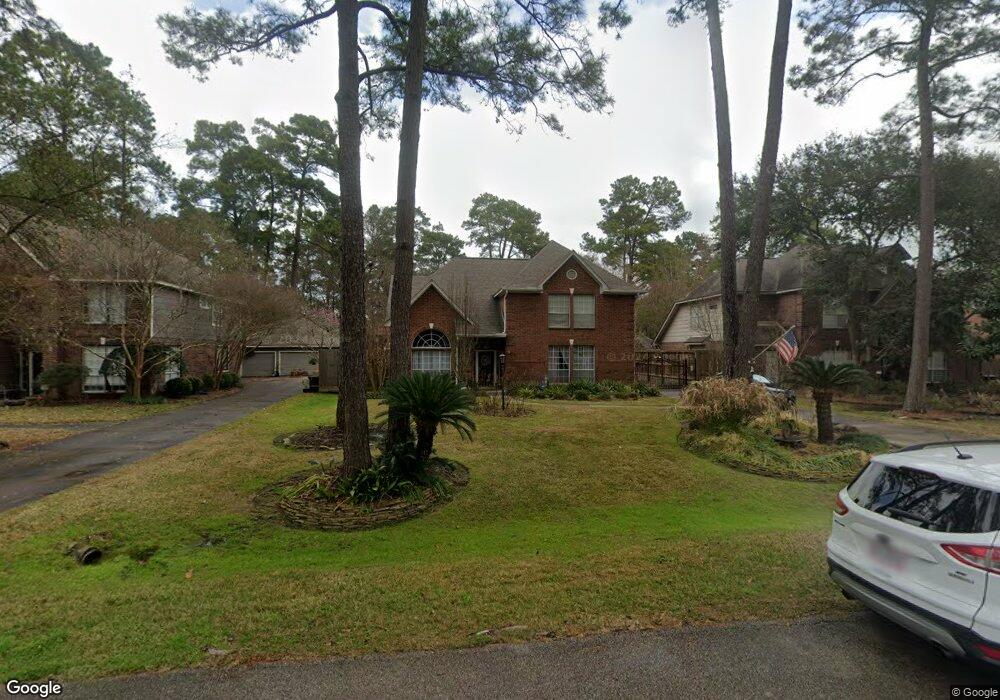
12118 Silver Creek Dr Houston, TX 77070
Estimated Value: $420,000 - $499,845
4
Beds
4
Baths
3,212
Sq Ft
$144/Sq Ft
Est. Value
About This Home
This home is located at 12118 Silver Creek Dr, Houston, TX 77070 and is currently estimated at $463,711, approximately $144 per square foot. 12118 Silver Creek Dr is a home located in Harris County with nearby schools including Hamilton Elementary School, Hamilton Middle School, and Cypress Creek High School.
Ownership History
Date
Name
Owned For
Owner Type
Purchase Details
Closed on
Jul 30, 2009
Sold by
Vanetten Elwyn R and Van Etten Virginia
Bought by
Vanetten Peter Clyde and Rawlins Van Etten Ruth Charleen Charley
Current Estimated Value
Purchase Details
Closed on
May 30, 2007
Sold by
Slavin Charles D and Slavin Laurie N
Bought by
Vanetten Elwyn R and Van Etten Virginia
Home Financials for this Owner
Home Financials are based on the most recent Mortgage that was taken out on this home.
Original Mortgage
$227,200
Outstanding Balance
$138,872
Interest Rate
6.17%
Mortgage Type
Purchase Money Mortgage
Estimated Equity
$324,839
Purchase Details
Closed on
Sep 6, 1994
Sold by
Sowden Michael W and Sowden Jamey W
Bought by
Blackwell John H and Blackwell Wonhui
Home Financials for this Owner
Home Financials are based on the most recent Mortgage that was taken out on this home.
Original Mortgage
$107,000
Interest Rate
8.78%
Create a Home Valuation Report for This Property
The Home Valuation Report is an in-depth analysis detailing your home's value as well as a comparison with similar homes in the area
Home Values in the Area
Average Home Value in this Area
Purchase History
| Date | Buyer | Sale Price | Title Company |
|---|---|---|---|
| Vanetten Peter Clyde | -- | None Available | |
| Vanetten Elwyn R | -- | First American Title | |
| Blackwell John H | -- | Chicago Title |
Source: Public Records
Mortgage History
| Date | Status | Borrower | Loan Amount |
|---|---|---|---|
| Open | Vanetten Elwyn R | $227,200 | |
| Previous Owner | Blackwell John H | $107,000 |
Source: Public Records
Tax History Compared to Growth
Tax History
| Year | Tax Paid | Tax Assessment Tax Assessment Total Assessment is a certain percentage of the fair market value that is determined by local assessors to be the total taxable value of land and additions on the property. | Land | Improvement |
|---|---|---|---|---|
| 2025 | $3,182 | $418,761 | $101,931 | $316,830 |
| 2024 | $3,182 | $481,042 | $85,064 | $395,978 |
| 2023 | $3,182 | $457,971 | $85,064 | $372,907 |
| 2022 | $8,377 | $392,250 | $71,131 | $321,119 |
| 2021 | $8,025 | $318,501 | $71,131 | $247,370 |
| 2020 | $7,974 | $306,769 | $54,265 | $252,504 |
| 2019 | $8,823 | $328,397 | $51,332 | $277,065 |
| 2018 | $3,064 | $297,182 | $28,599 | $268,583 |
| 2017 | $7,807 | $297,182 | $28,599 | $268,583 |
| 2016 | $7,097 | $265,350 | $28,599 | $236,751 |
| 2015 | $5,435 | $257,859 | $28,599 | $229,260 |
| 2014 | $5,435 | $243,905 | $28,599 | $215,306 |
Source: Public Records
Map
Nearby Homes
- 12120 Silver Creek Dr
- 15002 Carols Way Dr
- 14703 Forest Lodge Dr
- 12219 Rocky Lake Ct
- 14915 Rain Shadow Ct
- 12303 Christy Mill Ct
- 14826 N Eldridge Pkwy
- 12402 Malcomson Rd
- 14918 Shady Bend Dr
- 12126 Normont Dr
- 14902 Forest Lodge Dr
- 12911 Forest Meadow Dr
- 11927 Oakcroft Dr
- 12102 Moorcreek Dr
- 12227 Moorcreek Dr
- 12023 Normont Dr
- 12111 Moorcreek Dr
- 14615 Sunny Grove Dr
- 12511 Oakcroft Dr
- 15014 River Park Dr
- 12114 Silver Creek Dr
- 12112 Silver Creek Dr
- 12122 Silver Creek Dr
- 12117 Oak Bluff Dr
- 12110 Silver Creek Dr
- 12119 Oak Bluff Dr
- 14918 Carols Way Dr
- 12119 Silver Creek Dr
- 14914 Carols Way Dr
- 12111 Silver Creek Dr
- 14922 Carols Way Dr
- 14910 Carols Way Dr
- 12123 Silver Creek Dr
- 12115 Oak Bluff Dr
- 12107 Silver Creek Dr
- 12106 Silver Creek Dr
- 14906 Carols Way Dr
- 14930 Carols Way Dr
- 12107 Oak Bluff Dr
- 14902 Carols Way Dr