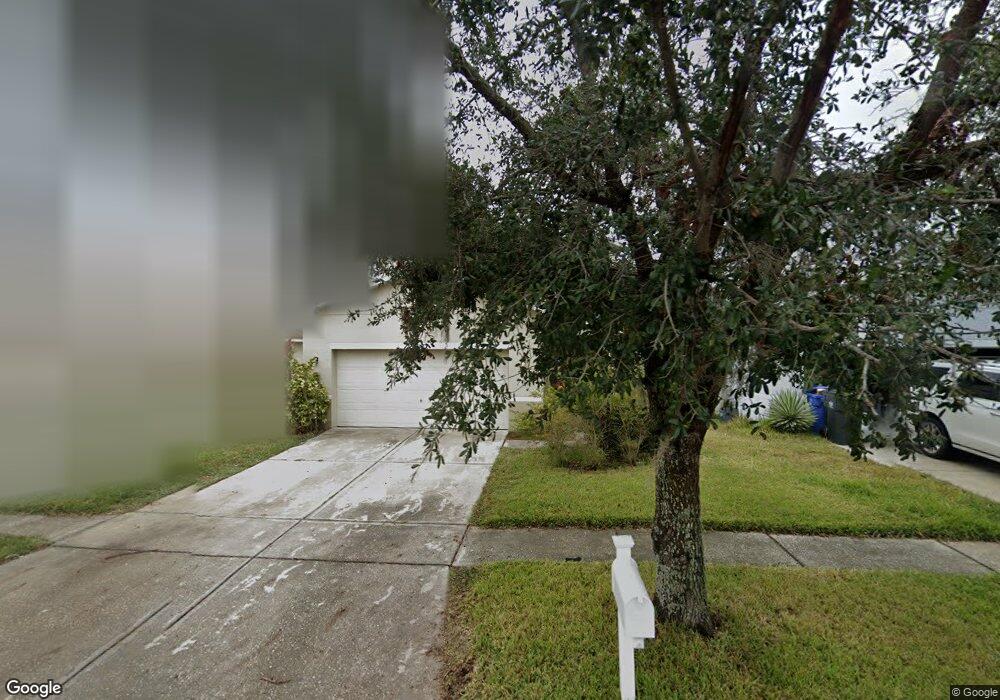
12119 Fox Bloom Ave Unit 1 Gibsonton, FL 33534
Estimated Value: $346,000 - $364,000
3
Beds
3
Baths
2,537
Sq Ft
$140/Sq Ft
Est. Value
About This Home
This home is located at 12119 Fox Bloom Ave Unit 1, Gibsonton, FL 33534 and is currently estimated at $354,259, approximately $139 per square foot. 12119 Fox Bloom Ave Unit 1 is a home located in Hillsborough County with nearby schools including Corr Elementary School, Eisenhower Middle School, and East Bay High School.
Ownership History
Date
Name
Owned For
Owner Type
Purchase Details
Closed on
Feb 25, 2011
Sold by
Wells Fargo Bank Na
Bought by
Beauford Whanica and Beauford Rory D
Current Estimated Value
Home Financials for this Owner
Home Financials are based on the most recent Mortgage that was taken out on this home.
Original Mortgage
$115,983
Outstanding Balance
$81,397
Interest Rate
5.25%
Mortgage Type
FHA
Estimated Equity
$272,862
Purchase Details
Closed on
Jul 23, 2010
Sold by
Kaur Parvinder
Bought by
Wells Fargo Bank N A
Purchase Details
Closed on
Jun 30, 2005
Sold by
Kb Home Tampa Llc
Bought by
Singh Navdeep and Kaur Parvinder
Home Financials for this Owner
Home Financials are based on the most recent Mortgage that was taken out on this home.
Original Mortgage
$154,050
Interest Rate
5.54%
Mortgage Type
Fannie Mae Freddie Mac
Create a Home Valuation Report for This Property
The Home Valuation Report is an in-depth analysis detailing your home's value as well as a comparison with similar homes in the area
Home Values in the Area
Average Home Value in this Area
Purchase History
| Date | Buyer | Sale Price | Title Company |
|---|---|---|---|
| Beauford Whanica | $119,000 | None Available | |
| Wells Fargo Bank N A | -- | None Available | |
| Singh Navdeep | $183,800 | First American Title Ins Co |
Source: Public Records
Mortgage History
| Date | Status | Borrower | Loan Amount |
|---|---|---|---|
| Open | Beauford Whanica | $115,983 | |
| Previous Owner | Singh Navdeep | $154,050 | |
| Closed | Singh Navdeep | $28,900 |
Source: Public Records
Tax History Compared to Growth
Tax History
| Year | Tax Paid | Tax Assessment Tax Assessment Total Assessment is a certain percentage of the fair market value that is determined by local assessors to be the total taxable value of land and additions on the property. | Land | Improvement |
|---|---|---|---|---|
| 2024 | $2,023 | $122,210 | -- | -- |
| 2023 | $2,019 | $118,650 | $0 | $0 |
| 2022 | $1,866 | $115,194 | $0 | $0 |
| 2021 | $1,810 | $111,839 | $0 | $0 |
| 2020 | $1,730 | $110,295 | $0 | $0 |
| 2019 | $1,645 | $107,815 | $0 | $0 |
| 2018 | $1,593 | $105,805 | $0 | $0 |
| 2017 | $1,563 | $147,017 | $0 | $0 |
| 2016 | $1,518 | $101,498 | $0 | $0 |
| 2015 | $1,532 | $100,792 | $0 | $0 |
| 2014 | $1,508 | $99,992 | $0 | $0 |
| 2013 | -- | $98,514 | $0 | $0 |
Source: Public Records
Map
Nearby Homes
- 7515 Dragon Fly Loop
- 12201 Citrus Leaf Dr
- 7711 Tangle Rush Dr
- 7620 Tangle Rush Dr
- 7523 Tangle Brook Blvd
- 12119 Barnsley Reserve Place
- 7518 Tangle Brook Blvd
- 11647 Tangle Stone Dr
- 11632 Tangle Stone Dr
- 12019 Grand Kempston Dr
- 12130 S Us Highway 41 Unit 186
- 12130 S Us Highway 41 Unit 147
- 12130 S Us Highway 41 Unit 21
- 12130 S Us Highway 41 Unit 102
- 12130 S Us Highway 41 Unit 14
- 12130 S Us Highway 41 Unit 166
- 12130 S Us Highway 41 Unit 107
- 12130 S Us Highway 41 Unit 156
- 12130 S Us Highway 41 Unit 144
- 12130 S Us Highway 41 Unit 88
- 12117 Fox Bloom Ave
- 12121 Fox Bloom Ave
- 12115 Fox Bloom Ave
- 12123 Fox Bloom Ave
- 12120 Fern Haven Ave
- 12118 Fern Haven Ave
- 12122 Fern Haven Ave
- 12113 Fox Bloom Ave
- 12125 Fox Bloom Ave
- 12124 Fern Haven Ave
- 12116 Fern Haven Ave
- 12120 Fox Bloom Ave Unit 1
- 12111 Fox Bloom Ave Unit 1
- 12127 Fox Bloom Ave
- 12126 Fern Haven Ave
- 12114 Fern Haven Ave
- 12122 Fox Bloom Ave
- 12118 Fox Bloom Ave
- 12124 Fox Bloom Ave