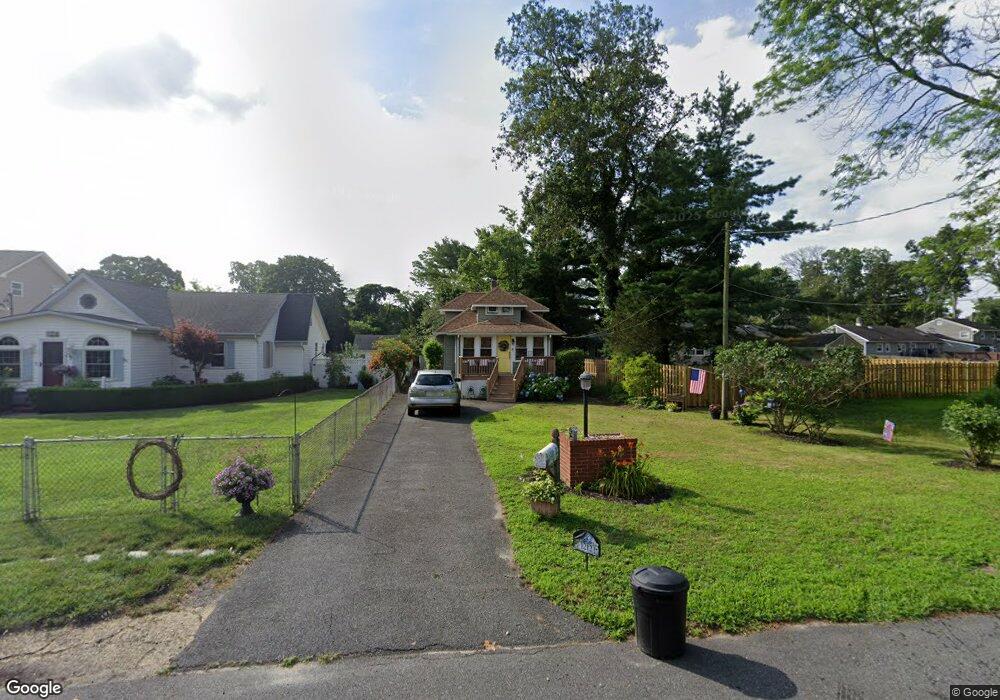
1212 2nd St Northfield, NJ 08225
Estimated Value: $227,601 - $352,000
--
Bed
--
Bath
825
Sq Ft
$372/Sq Ft
Est. Value
About This Home
This home is located at 1212 2nd St, Northfield, NJ 08225 and is currently estimated at $307,150, approximately $372 per square foot. 1212 2nd St is a home located in Atlantic County with nearby schools including Northfield Community Elementary School, Northfield Community Middle School, and Mainland Regional High School.
Ownership History
Date
Name
Owned For
Owner Type
Purchase Details
Closed on
Aug 30, 2001
Sold by
Justis Robert N and Justis Frances P
Bought by
Daly Mary Jo
Current Estimated Value
Home Financials for this Owner
Home Financials are based on the most recent Mortgage that was taken out on this home.
Original Mortgage
$90,132
Outstanding Balance
$35,300
Interest Rate
7.05%
Mortgage Type
FHA
Estimated Equity
$271,850
Purchase Details
Closed on
Nov 24, 1995
Sold by
Justis Robert N
Bought by
Justis Robert N and Justis Frances P
Create a Home Valuation Report for This Property
The Home Valuation Report is an in-depth analysis detailing your home's value as well as a comparison with similar homes in the area
Home Values in the Area
Average Home Value in this Area
Purchase History
| Date | Buyer | Sale Price | Title Company |
|---|---|---|---|
| Daly Mary Jo | $111,000 | Fidelity National Title Ins | |
| Justis Robert N | -- | -- |
Source: Public Records
Mortgage History
| Date | Status | Borrower | Loan Amount |
|---|---|---|---|
| Open | Daly Mary Jo | $90,132 |
Source: Public Records
Tax History Compared to Growth
Tax History
| Year | Tax Paid | Tax Assessment Tax Assessment Total Assessment is a certain percentage of the fair market value that is determined by local assessors to be the total taxable value of land and additions on the property. | Land | Improvement |
|---|---|---|---|---|
| 2025 | $5,187 | $144,400 | $56,100 | $88,300 |
| 2024 | $5,187 | $144,400 | $56,100 | $88,300 |
| 2023 | $5,042 | $144,400 | $56,100 | $88,300 |
| 2022 | $5,042 | $144,400 | $56,100 | $88,300 |
| 2021 | $4,989 | $144,400 | $56,100 | $88,300 |
| 2020 | $5,008 | $144,400 | $56,100 | $88,300 |
| 2019 | $4,923 | $144,400 | $56,100 | $88,300 |
| 2018 | $4,835 | $144,400 | $56,100 | $88,300 |
| 2017 | $4,674 | $144,400 | $56,100 | $88,300 |
| 2016 | $4,488 | $144,400 | $56,100 | $88,300 |
| 2015 | $4,426 | $144,400 | $56,100 | $88,300 |
| 2014 | $4,185 | $144,400 | $56,100 | $88,300 |
Source: Public Records
Map
Nearby Homes
- 1013 New Rd
- 607 Herzel Ave
- 603 Banning Ave
- 219 Northfield Ave
- 221 Northfield Ave
- 711 1st St
- 19 Locust Dr
- 15 Northfield Ave
- 309 Clark Place
- 11 Roosevelt Ave
- 12 Oakview Dr
- 1202 Shore Rd
- 700 Debora Ave
- 803 Adele Ave
- 523 Walnut Ave
- 1611 Shore Rd
- 400 Dolphin Ave
- 147 Bonnie Lee Dr
- 202 English Ln
- 2024 Zion Rd