Estimated Value: $330,000 - $444,000
4
Beds
3
Baths
2,839
Sq Ft
$137/Sq Ft
Est. Value
About This Home
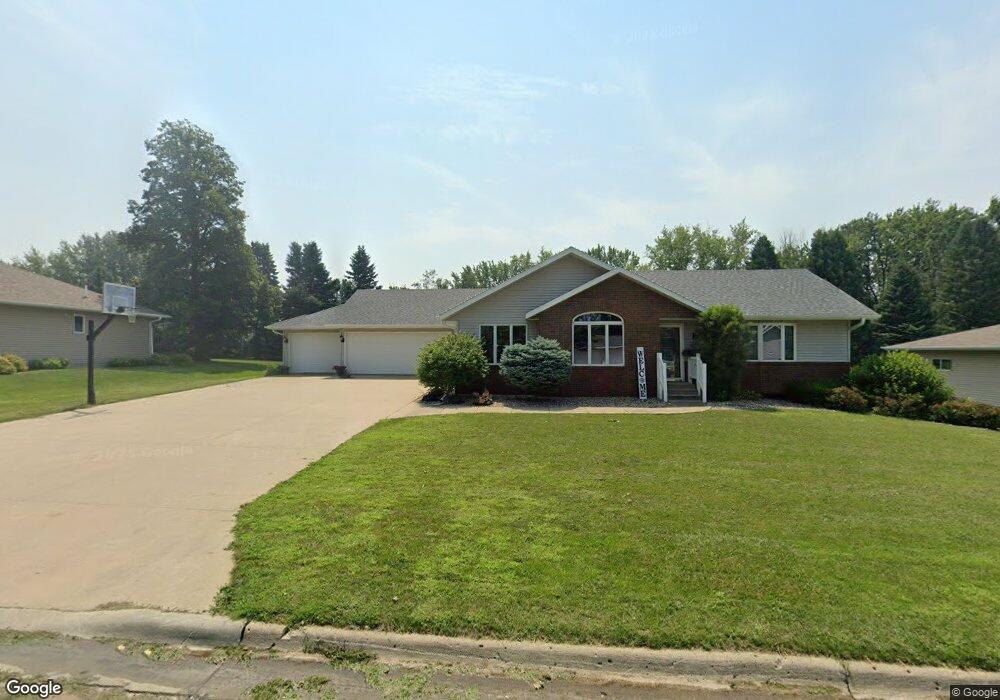
This home is located at 1212 7th St, Hull, IA 51239 and is currently estimated at $387,658, approximately $136 per square foot. 1212 7th St is a home located in Sioux County with nearby schools including Boyden-Hull Elementary School, Boyden-Hull High School, and Hull Christian School.
Ownership History
Date
Name
Owned For
Owner Type
Purchase Details
Closed on
Aug 24, 2024
Sold by
Burdette M Oelrich Revocable Trust and Oelrich Burdette M
Bought by
Hoekstra Michelle
Current Estimated Value
Home Financials for this Owner
Home Financials are based on the most recent Mortgage that was taken out on this home.
Original Mortgage
$100,000
Outstanding Balance
$97,345
Interest Rate
6.77%
Mortgage Type
New Conventional
Estimated Equity
$290,313
Purchase Details
Closed on
Dec 24, 2005
Sold by
Degroot Larry De and Degroot Helen De
Bought by
Oelrich Charles and Oelrich Burdette
Create a Home Valuation Report for This Property
The Home Valuation Report is an in-depth analysis detailing your home's value as well as a comparison with similar homes in the area
Purchase History
| Date | Buyer | Sale Price | Title Company |
|---|---|---|---|
| Hoekstra Michelle | $385,000 | None Listed On Document | |
| Oelrich Charles | $185,000 | None Available |
Source: Public Records
Mortgage History
| Date | Status | Borrower | Loan Amount |
|---|---|---|---|
| Open | Hoekstra Michelle | $100,000 |
Source: Public Records
Tax History
| Year | Tax Paid | Tax Assessment Tax Assessment Total Assessment is a certain percentage of the fair market value that is determined by local assessors to be the total taxable value of land and additions on the property. | Land | Improvement |
|---|---|---|---|---|
| 2025 | $4,604 | $393,480 | $29,400 | $364,080 |
| 2024 | $4,604 | $327,240 | $29,400 | $297,840 |
| 2023 | $4,636 | $327,240 | $29,400 | $297,840 |
| 2022 | $4,636 | $278,140 | $29,400 | $248,740 |
| 2021 | $4,400 | $277,350 | $29,400 | $247,950 |
| 2020 | $4,400 | $250,850 | $29,400 | $221,450 |
| 2019 | $4,240 | $238,950 | $22,050 | $216,900 |
| 2018 | $4,322 | $238,950 | $22,050 | $216,900 |
| 2017 | $4,322 | $238,950 | $22,050 | $216,900 |
| 2014 | $3,560 | $200,320 | $0 | $0 |
Source: Public Records
Map
Nearby Homes
- 1219 3rd St
- 1311 Aspen St
- 1208 2nd St
- 2014 Maple St
- 1502 2nd St
- 1013 Walnut St
- 1509 Birch St
- 1818 1st St
- 423 Railroad St
- 301 Black Forest Rd
- 3273 Hickory Ave
- 3451 Jackson Ave
- 3585 Ironwood Ave
- 3920 310th St
- 408 Grove St
- 1003 Horizon Rd
- 707 Colfax St
- 2629 Warren Cir
- 1558 11th Ave NE
- 1026 15th St Cir NE
Your Personal Tour Guide
Ask me questions while you tour the home.