Estimated Value: $71,000 - $119,000
3
Beds
1
Bath
1,073
Sq Ft
$83/Sq Ft
Est. Value
About This Home
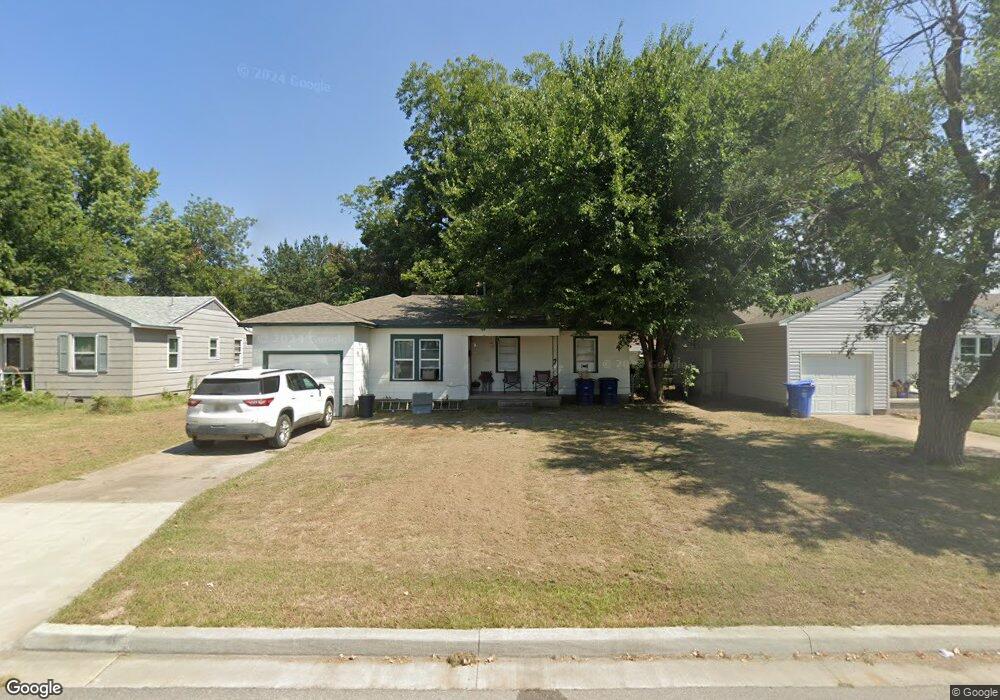
This home is located at 1212 A St NE, Miami, OK 74354 and is currently estimated at $88,845, approximately $82 per square foot. 1212 A St NE is a home located in Ottawa County with nearby schools including Miami High School and Mt. Olive Lutheran School.
Ownership History
Date
Name
Owned For
Owner Type
Purchase Details
Closed on
Jun 24, 2019
Sold by
Wells Fargo Bank Na
Bought by
Equity & Help Inc and 121Ast354 Trust
Current Estimated Value
Purchase Details
Closed on
Apr 12, 2019
Sold by
Harding Jeffrey
Bought by
Wells Fargo Bank N A
Purchase Details
Closed on
Apr 20, 2007
Sold by
Baird Brett and Baird Becky
Bought by
Harding Jeffrey and Harding Tera
Home Financials for this Owner
Home Financials are based on the most recent Mortgage that was taken out on this home.
Original Mortgage
$60,057
Interest Rate
6.15%
Mortgage Type
FHA
Purchase Details
Closed on
Dec 1, 2005
Sold by
Federal National Mortgage Association
Bought by
Baird Brett and Baird Becky
Purchase Details
Closed on
Oct 28, 2005
Sold by
Scruggs Juli A
Bought by
Federal National Mortgage Association
Purchase Details
Closed on
Mar 8, 2002
Bought by
Scruggs Juli A
Create a Home Valuation Report for This Property
The Home Valuation Report is an in-depth analysis detailing your home's value as well as a comparison with similar homes in the area
Home Values in the Area
Average Home Value in this Area
Purchase History
| Date | Buyer | Sale Price | Title Company |
|---|---|---|---|
| Equity & Help Inc | $11,000 | Orange Coast Lender Services | |
| Wells Fargo Bank N A | $53,643 | None Available | |
| Harding Jeffrey | $61,000 | None Available | |
| Baird Brett | $28,000 | None Available | |
| Federal National Mortgage Association | $46,353 | None Available | |
| Scruggs Juli A | $43,500 | -- |
Source: Public Records
Mortgage History
| Date | Status | Borrower | Loan Amount |
|---|---|---|---|
| Previous Owner | Harding Jeffrey | $60,057 |
Source: Public Records
Tax History Compared to Growth
Tax History
| Year | Tax Paid | Tax Assessment Tax Assessment Total Assessment is a certain percentage of the fair market value that is determined by local assessors to be the total taxable value of land and additions on the property. | Land | Improvement |
|---|---|---|---|---|
| 2025 | $607 | $5,514 | $741 | $4,773 |
| 2024 | $607 | $6,299 | $741 | $5,558 |
| 2023 | $607 | $7,107 | $741 | $6,366 |
| 2022 | $626 | $6,768 | $741 | $6,027 |
| 2021 | $609 | $6,446 | $741 | $5,705 |
| 2020 | $585 | $6,139 | $741 | $5,398 |
| 2019 | $422 | $6,139 | $741 | $5,398 |
| 2018 | $478 | $6,788 | $741 | $6,047 |
| 2017 | $486 | $6,788 | $741 | $6,047 |
| 2016 | $456 | $6,679 | $741 | $5,938 |
| 2015 | $284 | $3,192 | $658 | $2,534 |
| 2014 | $449 | $6,484 | $741 | $5,743 |
Source: Public Records
Map
Nearby Homes