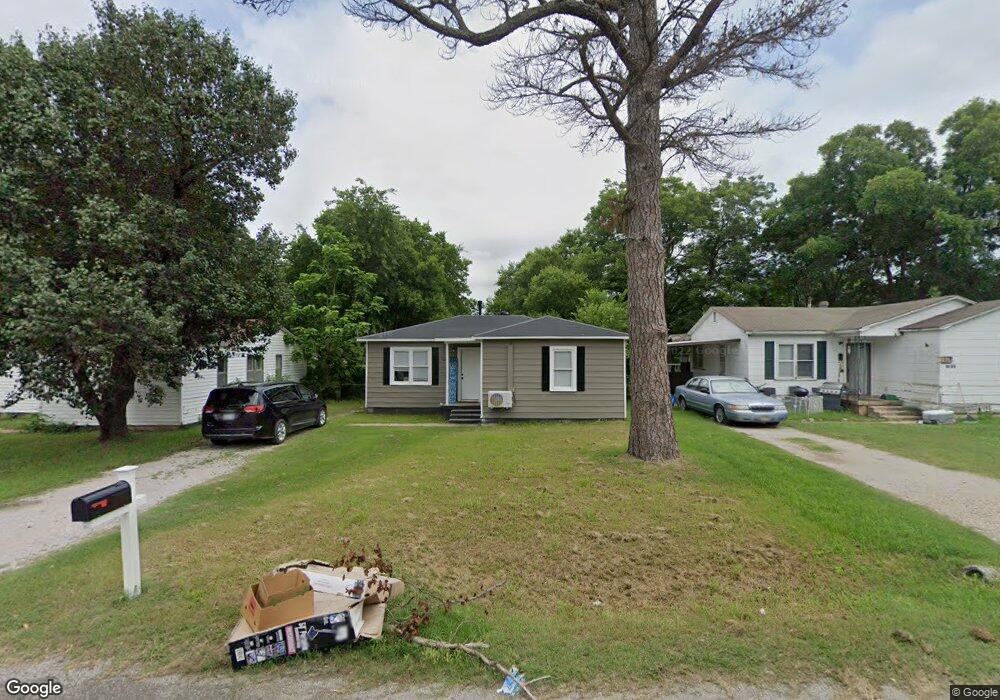
1212 A St SE Ardmore, OK 73401
Estimated Value: $67,000 - $108,000
2
Beds
1
Bath
979
Sq Ft
$90/Sq Ft
Est. Value
About This Home
This home is located at 1212 A St SE, Ardmore, OK 73401 and is currently estimated at $87,834, approximately $89 per square foot. 1212 A St SE is a home located in Carter County with nearby schools including Jefferson Elementary School, Ardmore Middle School, and Ardmore High School.
Ownership History
Date
Name
Owned For
Owner Type
Purchase Details
Closed on
Apr 8, 2022
Sold by
John Baxter Billy and John Kathy
Bought by
White Rock Investments Llc
Current Estimated Value
Purchase Details
Closed on
Jun 18, 2021
Sold by
Double C Properties Llc
Bought by
White Rock Investments Llc
Home Financials for this Owner
Home Financials are based on the most recent Mortgage that was taken out on this home.
Original Mortgage
$61,549
Interest Rate
2.9%
Mortgage Type
Commercial
Purchase Details
Closed on
Mar 23, 1999
Sold by
Wernli Joe L and Wernli Phylli
Bought by
West Stacey D and West Franc
Create a Home Valuation Report for This Property
The Home Valuation Report is an in-depth analysis detailing your home's value as well as a comparison with similar homes in the area
Purchase History
| Date | Buyer | Sale Price | Title Company |
|---|---|---|---|
| White Rock Investments Llc | $12,000 | Arbuckle Closing & Escrow | |
| White Rock Investments Llc | $37,000 | Arbuckle Closing & Escrow | |
| West Stacey D | $17,500 | -- |
Source: Public Records
Mortgage History
| Date | Status | Borrower | Loan Amount |
|---|---|---|---|
| Previous Owner | White Rock Investments Llc | $61,549 |
Source: Public Records
Tax History
| Year | Tax Paid | Tax Assessment Tax Assessment Total Assessment is a certain percentage of the fair market value that is determined by local assessors to be the total taxable value of land and additions on the property. | Land | Improvement |
|---|---|---|---|---|
| 2025 | $513 | $5,139 | $801 | $4,338 |
| 2024 | $483 | $4,895 | $763 | $4,132 |
| 2023 | $460 | $4,662 | $756 | $3,906 |
| 2022 | $424 | $4,440 | $748 | $3,692 |
| 2021 | $472 | $4,679 | $637 | $4,042 |
| 2020 | $443 | $4,456 | $504 | $3,952 |
| 2019 | $433 | $4,456 | $504 | $3,952 |
| 2018 | $440 | $4,456 | $504 | $3,952 |
| 2017 | $407 | $4,456 | $504 | $3,952 |
| 2016 | $470 | $5,040 | $504 | $4,536 |
| 2015 | $279 | $3,635 | $166 | $3,469 |
| 2014 | $266 | $3,461 | $151 | $3,310 |
Source: Public Records
Map
Nearby Homes
Your Personal Tour Guide
Ask me questions while you tour the home.