Estimated Value: $173,000 - $179,000
3
Beds
1
Bath
1,040
Sq Ft
$170/Sq Ft
Est. Value
About This Home
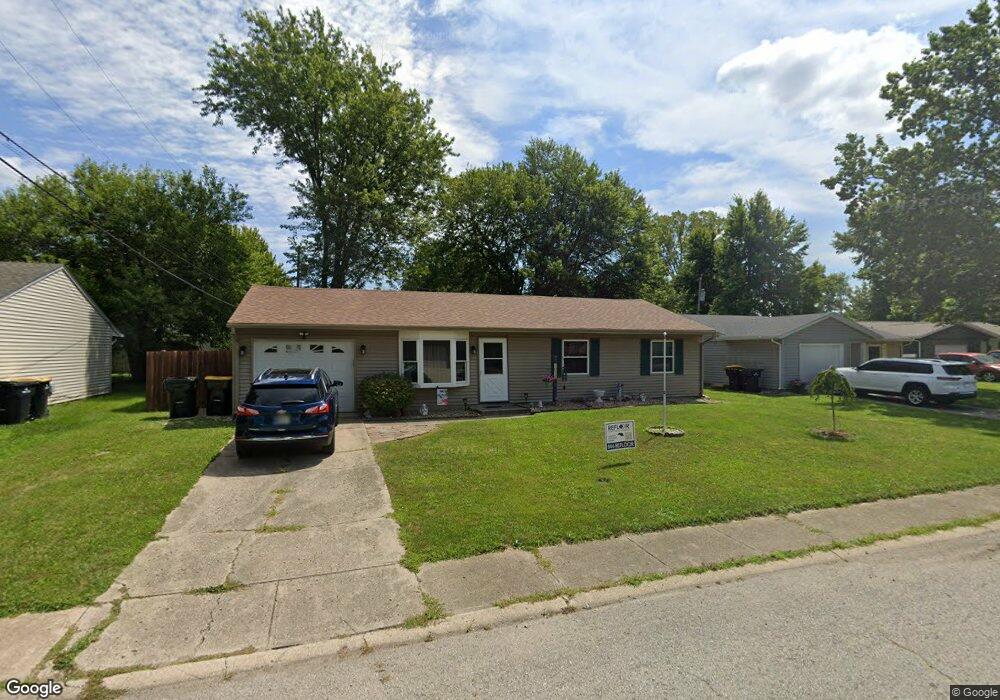
This home is located at 1212 Busby Rd, Lapel, IN 46051 and is currently estimated at $176,310, approximately $169 per square foot. 1212 Busby Rd is a home located in Madison County with nearby schools including Lapel Elementary School, Lapel Middle School, and Lapel Senior High School.
Ownership History
Date
Name
Owned For
Owner Type
Purchase Details
Closed on
Jun 28, 2012
Sold by
Fannie Mae
Bought by
Springer Gail R
Current Estimated Value
Home Financials for this Owner
Home Financials are based on the most recent Mortgage that was taken out on this home.
Original Mortgage
$36,670
Outstanding Balance
$4,918
Interest Rate
3.77%
Mortgage Type
New Conventional
Estimated Equity
$171,392
Purchase Details
Closed on
Sep 16, 2011
Sold by
Pine Joni G
Bought by
Federal National Mortgage Association
Create a Home Valuation Report for This Property
The Home Valuation Report is an in-depth analysis detailing your home's value as well as a comparison with similar homes in the area
Home Values in the Area
Average Home Value in this Area
Purchase History
| Date | Buyer | Sale Price | Title Company |
|---|---|---|---|
| Springer Gail R | -- | None Available | |
| Federal National Mortgage Association | $45,000 | None Available |
Source: Public Records
Mortgage History
| Date | Status | Borrower | Loan Amount |
|---|---|---|---|
| Open | Springer Gail R | $36,670 |
Source: Public Records
Tax History Compared to Growth
Tax History
| Year | Tax Paid | Tax Assessment Tax Assessment Total Assessment is a certain percentage of the fair market value that is determined by local assessors to be the total taxable value of land and additions on the property. | Land | Improvement |
|---|---|---|---|---|
| 2025 | $715 | $90,300 | $14,700 | $75,600 |
| 2024 | $715 | $90,300 | $14,700 | $75,600 |
| 2023 | $618 | $83,000 | $14,000 | $69,000 |
| 2022 | $649 | $82,600 | $13,600 | $69,000 |
| 2021 | $536 | $76,800 | $13,600 | $63,200 |
| 2020 | $580 | $76,800 | $13,000 | $63,800 |
| 2019 | $522 | $75,000 | $13,000 | $62,000 |
| 2018 | $519 | $69,200 | $13,000 | $56,200 |
| 2017 | $483 | $68,600 | $13,000 | $55,600 |
| 2016 | $475 | $68,600 | $13,000 | $55,600 |
| 2014 | $491 | $68,500 | $13,000 | $55,500 |
| 2013 | $491 | $68,500 | $13,000 | $55,500 |
Source: Public Records
Map
Nearby Homes
- 1019 N John St
- 0 Vine St
- 223 W 11th St
- 614 S Woodward St
- 223 W 9th St
- Aspen II Plan at Tuscany
- Spruce Plan at Tuscany
- Norway Plan at Tuscany
- Chestnut Plan at Tuscany
- Ashton Plan at Tuscany
- Juniper Plan at Tuscany
- Ironwood Plan at Tuscany
- Palmetto Plan at Tuscany
- Empress Plan at Tuscany
- Bradford Plan at Tuscany
- Cooper Plan at Tuscany
- 108 W 5th St
- 3110 Montgomery Blvd
- 9417 Crimson Cir
- Arlington Plan at Montgomery Farms