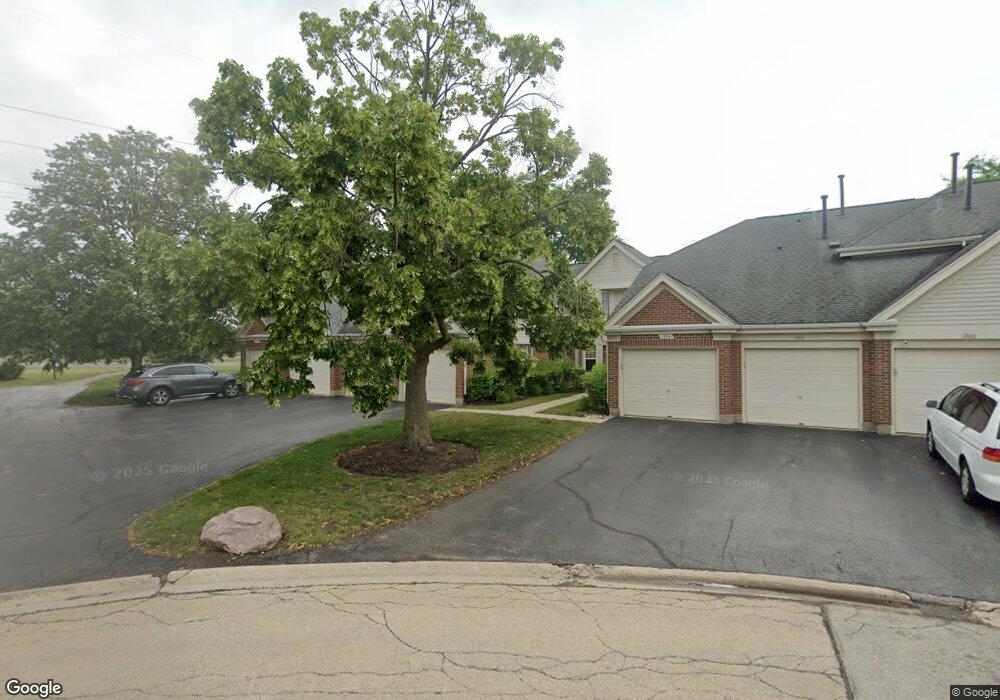
1212 Churchill Ct Unit 927 Buffalo Grove, IL 60089
Estimated Value: $303,000 - $325,000
2
Beds
2
Baths
1,131
Sq Ft
$276/Sq Ft
Est. Value
About This Home
This home is located at 1212 Churchill Ct Unit 927, Buffalo Grove, IL 60089 and is currently estimated at $312,491, approximately $276 per square foot. 1212 Churchill Ct Unit 927 is a home located in Lake County with nearby schools including Meridian Middle School, Tripp Elementary School, and Aptakisic Junior High School.
Ownership History
Date
Name
Owned For
Owner Type
Purchase Details
Closed on
May 4, 2009
Sold by
Borders Keith Swalgren
Bought by
Konopka Michael
Current Estimated Value
Home Financials for this Owner
Home Financials are based on the most recent Mortgage that was taken out on this home.
Original Mortgage
$167,226
Outstanding Balance
$105,941
Interest Rate
4.9%
Mortgage Type
FHA
Estimated Equity
$206,550
Purchase Details
Closed on
Dec 10, 2002
Sold by
Sambor Brian and Sambor Joanna
Bought by
Borders Keith Swalgren
Home Financials for this Owner
Home Financials are based on the most recent Mortgage that was taken out on this home.
Original Mortgage
$105,000
Interest Rate
6.13%
Purchase Details
Closed on
Jun 30, 1999
Sold by
Count Linda S
Bought by
Sambor Brian and Braa Joanna
Home Financials for this Owner
Home Financials are based on the most recent Mortgage that was taken out on this home.
Original Mortgage
$131,850
Interest Rate
5.87%
Create a Home Valuation Report for This Property
The Home Valuation Report is an in-depth analysis detailing your home's value as well as a comparison with similar homes in the area
Home Values in the Area
Average Home Value in this Area
Purchase History
| Date | Buyer | Sale Price | Title Company |
|---|---|---|---|
| Konopka Michael | $173,000 | None Available | |
| Borders Keith Swalgren | $195,000 | Chicago Title Insurance Co | |
| Sambor Brian | $146,500 | Chicago Title Insurance Co |
Source: Public Records
Mortgage History
| Date | Status | Borrower | Loan Amount |
|---|---|---|---|
| Open | Konopka Michael | $167,226 | |
| Previous Owner | Borders Keith Swalgren | $105,000 | |
| Previous Owner | Sambor Brian | $131,850 |
Source: Public Records
Tax History Compared to Growth
Tax History
| Year | Tax Paid | Tax Assessment Tax Assessment Total Assessment is a certain percentage of the fair market value that is determined by local assessors to be the total taxable value of land and additions on the property. | Land | Improvement |
|---|---|---|---|---|
| 2024 | $7,650 | $78,713 | $22,124 | $56,589 |
| 2023 | $6,819 | $74,272 | $20,876 | $53,396 |
| 2022 | $6,819 | $69,796 | $19,618 | $50,178 |
| 2021 | $6,451 | $69,043 | $19,406 | $49,637 |
| 2020 | $6,451 | $69,278 | $19,472 | $49,806 |
| 2019 | $6,278 | $69,022 | $19,400 | $49,622 |
| 2018 | $5,087 | $55,773 | $21,087 | $34,686 |
| 2017 | $5,024 | $54,471 | $20,595 | $33,876 |
| 2016 | $4,859 | $52,160 | $19,721 | $32,439 |
| 2015 | $4,778 | $48,780 | $18,443 | $30,337 |
| 2014 | $4,143 | $41,292 | $14,857 | $26,435 |
| 2012 | $5,270 | $55,166 | $19,849 | $35,317 |
Source: Public Records
Map
Nearby Homes
- 1157 Russellwood Ct
- 148 White Branch Ct
- 60 E Fabish Dr
- 381 Bentley Place
- 1012 Hobson Dr
- 15 Thompson Ct
- 1272 Sandhurst Dr
- 51 W Fabish Dr
- 12 Aberdeen Ct
- 620 Cobblestone Ln
- 16202 W Aptakisic Rd
- 938 Hidden Lake Dr
- 720 Dunhill Dr
- 20772 N William Ave
- 20665 N Weiland Rd
- 1113 Lockwood Dr
- 22118 N Prairie Rd
- 625 Marseilles Cir
- 455 Thorndale Dr
- 1118 Larraway Dr
- 1210 Churchill Ct
- 1214 Churchill Ct
- 1206 Churchill Ct
- 1216 Churchill Ct
- 1216 Churchill Ct Unit 9-27-D
- 1204 Churchill Ct
- 1204 Churchill Ct Unit 1
- 1202 Churchill Ct
- 1200 Churchill Ct
- 380 Cobbler Ln
- 384 Cobbler Ln
- 1224 Churchill Ct
- 1224 Churchill Ct Unit 12-26-
- 1222 Churchill Ct
- 1222 Churchill Ct Unit 1222
- 1220 Churchill Ct
- 1226 Churchill Ct
- 386 Cobbler Ln
- 1228 Churchill Ct
- 1230 Churchill Ct Unit 1230