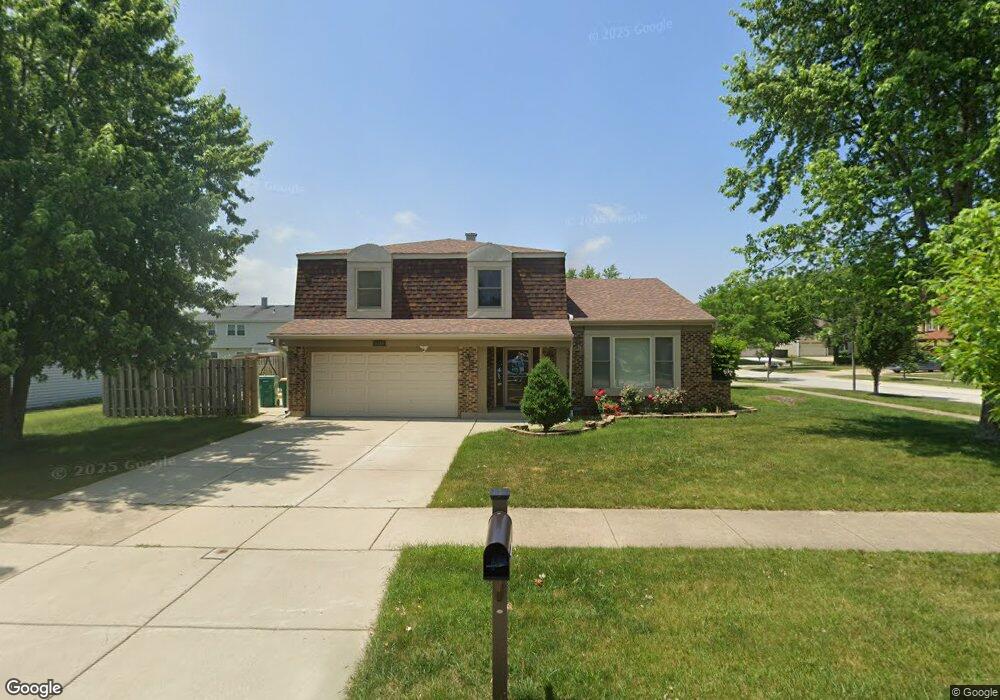
1212 Dannet Ct Buffalo Grove, IL 60089
Prairie Park-Lake County NeighborhoodEstimated Value: $412,000 - $590,000
4
Beds
3
Baths
1,485
Sq Ft
$343/Sq Ft
Est. Value
About This Home
This home is located at 1212 Dannet Ct, Buffalo Grove, IL 60089 and is currently estimated at $508,956, approximately $342 per square foot. 1212 Dannet Ct is a home located in Lake County with nearby schools including Prairie Elementary School, Twin Groves Middle School, and Adlai E Stevenson High School.
Ownership History
Date
Name
Owned For
Owner Type
Purchase Details
Closed on
Oct 21, 2021
Sold by
Amin Manoj M and Amin Nisha
Bought by
Amin Nisha and Amin Manoj M
Current Estimated Value
Purchase Details
Closed on
Jun 24, 2005
Sold by
Corrish John C and Corrish Elaine S
Bought by
Amin Manos M and Amin Nisha M
Home Financials for this Owner
Home Financials are based on the most recent Mortgage that was taken out on this home.
Original Mortgage
$178,000
Interest Rate
5.32%
Mortgage Type
Fannie Mae Freddie Mac
Purchase Details
Closed on
May 15, 1998
Sold by
Corrish Elaine S and Gould Elaine S
Bought by
Corrish John C and Corrish Elaine S
Home Financials for this Owner
Home Financials are based on the most recent Mortgage that was taken out on this home.
Original Mortgage
$100,000
Interest Rate
7.32%
Create a Home Valuation Report for This Property
The Home Valuation Report is an in-depth analysis detailing your home's value as well as a comparison with similar homes in the area
Home Values in the Area
Average Home Value in this Area
Purchase History
| Date | Buyer | Sale Price | Title Company |
|---|---|---|---|
| Amin Nisha | -- | Attorney | |
| Amin Manos M | $403,000 | St | |
| Corrish John C | -- | Ticor Title |
Source: Public Records
Mortgage History
| Date | Status | Borrower | Loan Amount |
|---|---|---|---|
| Closed | Amin Manos M | $178,000 | |
| Previous Owner | Corrish John C | $100,000 |
Source: Public Records
Tax History Compared to Growth
Tax History
| Year | Tax Paid | Tax Assessment Tax Assessment Total Assessment is a certain percentage of the fair market value that is determined by local assessors to be the total taxable value of land and additions on the property. | Land | Improvement |
|---|---|---|---|---|
| 2024 | $13,794 | $150,990 | $32,345 | $118,645 |
| 2023 | $13,076 | $142,470 | $30,520 | $111,950 |
| 2022 | $13,076 | $131,404 | $28,149 | $103,255 |
| 2021 | $12,524 | $129,987 | $27,845 | $102,142 |
| 2020 | $13,141 | $139,663 | $27,940 | $111,723 |
| 2019 | $12,958 | $139,148 | $27,837 | $111,311 |
| 2018 | $11,396 | $124,630 | $27,511 | $97,119 |
| 2017 | $10,972 | $121,178 | $26,869 | $94,309 |
| 2016 | $10,684 | $116,037 | $25,729 | $90,308 |
| 2015 | $10,399 | $108,517 | $24,062 | $84,455 |
| 2014 | $7,909 | $82,843 | $25,842 | $57,001 |
| 2012 | $7,843 | $83,009 | $25,894 | $57,115 |
Source: Public Records
Map
Nearby Homes
- 1027 Courtland Dr Unit 20
- 1327 Larchmont Dr
- 1315 Gail Dr
- 12 Cloverdale Ct
- 5107 N Arlington Heights Rd
- 810 Silver Rock Ln
- 760 Checker Dr
- 1325 Fairfax Ln
- 1117 Franklin Ln Unit C52
- 620 Twisted Oak Ln
- 531 Lasalle Ln
- 5135 Bridlewood Ct
- 630 Woodhollow Ln
- 938 Hidden Lake Dr
- 4106 Bob o Link Ln
- 1514 Sumter Dr
- 5255 Danbury Ct
- 1272 Sandhurst Dr
- 131 Autumn Ct Unit CT10602
- 1545 Chickamauga Ln
- 909 Dannet Rd
- 1208 Dannet Ct
- 911 Dannet Rd
- 821 Dannet Rd
- 1340 Devonshire Rd
- 1204 Dannet Ct
- 900 Dannet Rd
- 910 Dannet Rd
- 1342 Devonshire Rd
- 1209 Dannet Ct
- 824 Dannet Rd
- 817 Dannet Rd
- 1200 Dannet Ct
- 1344 Devonshire Rd
- 820 Dannet Rd
- 1205 Dannet Ct
- 1330 Devonshire Rd
- 813 Dannet Rd
- 1316 Devonshire Rd
- 1201 Dannet Ct