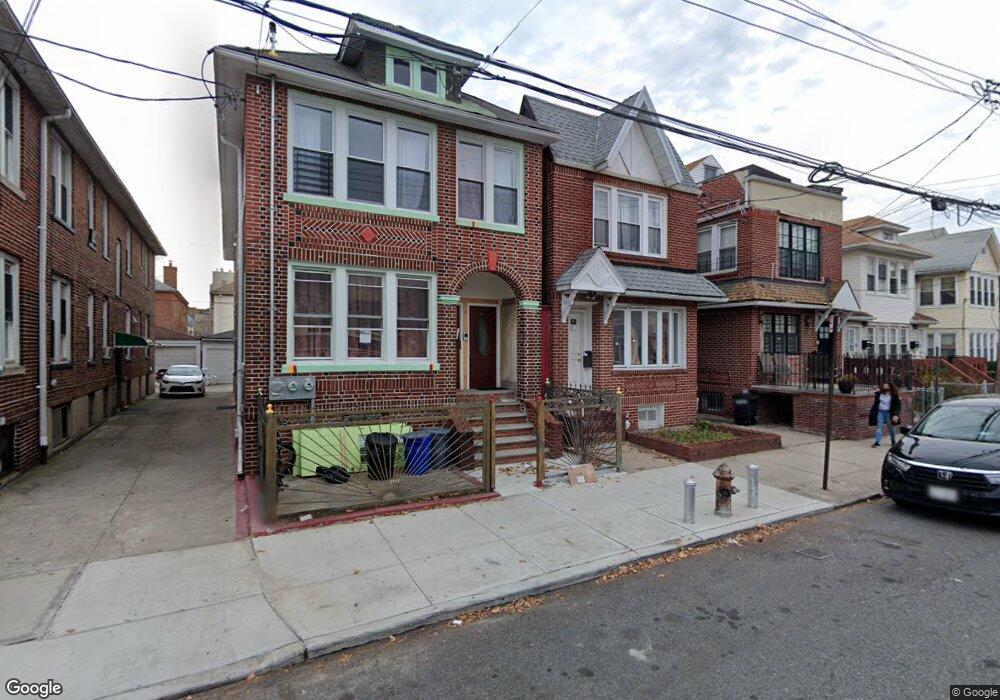
1212 E 34th St Brooklyn, NY 11210
Flatlands NeighborhoodEstimated Value: $866,236 - $1,159,000
Studio
--
Bath
1,824
Sq Ft
$569/Sq Ft
Est. Value
About This Home
This home is located at 1212 E 34th St, Brooklyn, NY 11210 and is currently estimated at $1,037,309, approximately $568 per square foot. 1212 E 34th St is a home located in Kings County with nearby schools including P.S. 193 Gil Hodges, Andries Hudde School, and Mesivta Tiferes Yisroel.
Ownership History
Date
Name
Owned For
Owner Type
Purchase Details
Closed on
Jul 12, 2004
Sold by
Joseph Florence
Bought by
Sene Marie
Current Estimated Value
Home Financials for this Owner
Home Financials are based on the most recent Mortgage that was taken out on this home.
Original Mortgage
$340,000
Outstanding Balance
$166,539
Interest Rate
6.03%
Mortgage Type
Purchase Money Mortgage
Estimated Equity
$870,770
Purchase Details
Closed on
Oct 31, 2000
Sold by
Louineus Willy
Bought by
Joseph Florence
Purchase Details
Closed on
Dec 19, 1995
Sold by
Resker John R
Bought by
Louineus Willy
Home Financials for this Owner
Home Financials are based on the most recent Mortgage that was taken out on this home.
Original Mortgage
$180,500
Interest Rate
7.13%
Create a Home Valuation Report for This Property
The Home Valuation Report is an in-depth analysis detailing your home's value as well as a comparison with similar homes in the area
Home Values in the Area
Average Home Value in this Area
Purchase History
| Date | Buyer | Sale Price | Title Company |
|---|---|---|---|
| Sene Marie | -- | -- | |
| Sene Marie | -- | -- | |
| Joseph Florence | -- | -- | |
| Joseph Florence | -- | -- | |
| Louineus Willy | $190,000 | Commonwealth Land Title Ins | |
| Louineus Willy | $190,000 | Commonwealth Land Title Ins |
Source: Public Records
Mortgage History
| Date | Status | Borrower | Loan Amount |
|---|---|---|---|
| Open | Sene Marie | $340,000 | |
| Closed | Sene Marie | $340,000 | |
| Previous Owner | Louineus Willy | $180,500 |
Source: Public Records
Tax History
| Year | Tax Paid | Tax Assessment Tax Assessment Total Assessment is a certain percentage of the fair market value that is determined by local assessors to be the total taxable value of land and additions on the property. | Land | Improvement |
|---|---|---|---|---|
| 2025 | $8,195 | $47,100 | $10,860 | $36,240 |
| 2024 | $8,195 | $53,220 | $10,860 | $42,360 |
| 2023 | $7,801 | $54,420 | $10,860 | $43,560 |
| 2022 | $7,373 | $51,540 | $10,860 | $40,680 |
| 2021 | $7,142 | $42,240 | $10,860 | $31,380 |
| 2020 | $3,639 | $48,840 | $10,860 | $37,980 |
| 2019 | $7,064 | $38,820 | $10,860 | $27,960 |
| 2018 | $6,465 | $33,177 | $8,387 | $24,790 |
| 2017 | $6,219 | $31,977 | $8,256 | $23,721 |
| 2016 | $5,721 | $30,168 | $9,874 | $20,294 |
| 2015 | $3,419 | $30,168 | $11,774 | $18,394 |
| 2014 | $3,419 | $29,306 | $10,173 | $19,133 |
Source: Public Records
Map
Nearby Homes
- 1203 E 34th St
- 3402 Avenue J
- 3412 Avenue J
- 1746 Flatbush Ave
- 1742 Flatbush Ave
- 3206 Avenue K
- 973 E 32nd St
- 961 E 32nd St
- 1992 New York Ave
- 1006 E 31st St
- 945 E 32nd St
- 1117 E 31st St
- 1229 E 37th St
- 1708 Flatbush Ave
- 1804 New York Ave
- 1202 E 38th St
- 1810 Avenue N Unit 4C
- 1810 Avenue N Unit 2F
- 1327 E 34th St
- 2031 New York Ave
- 1210 E 34th St
- 1214 E 34th St
- 1214 E 34 St
- 1216 E 34th St
- 1206 E 34th St
- 1218 E 34th St
- 1202 E 34th St
- Undisclosed Address
- 1909 New York Ave
- 1911 New York Ave
- 1905 New York Ave
- 1198 E 34th St
- 1220-1222 E 34th St
- 1220 E 34th St Unit 1222
- 1903 New York Ave Unit 2
- 1903 New York Ave
- 1915 New York Ave
- 1899 New York Ave
- 1919 New York Ave
- 1196 E 34th St
Your Personal Tour Guide
Ask me questions while you tour the home.